At the SpringOne conference (2017), Pivotal unveiled a new project for application monitoring named micrometer.
Before micrometer, the actuator metrics endpoint displayed metrics information, and supported customization and extension.
But a gap still remained: how does one go about getting this information into a monitoring system? One difficulty is that there are many different monitoring systems, and each has its own way of ingesting metrics data, and its own format for representing this information.
Micrometer makes a great analogy here: Think SLF4J, but for metrics. SLF4J is the popular logging façade for the JVM: a single API for logging, irrespective of the logging library in the backend. Micrometer does the same thing for monitoring: pick a monitoring solution for your Spring Boot application and your application will use the that monitoring solution’s mechanism for communicating its metrics data to it.
1. "Simple" Metrics
In the absence of configuring Spring Boot for a specific monitoring system, micrometer provides "simple" metrics out of the box.
-
Start the demo application
The response lists the metrics that micrometer automatically publishes.
For this application, this list includes:
-
JVM metrics (threads, memory, classes loaded, garbage collection).
-
Process information (uptime, files open).
-
System information (cpu usage).
-
Tomcat metrics (threads, sessions, requests).
Because we’re using a database with the hikari connection pool, we also get jdbc and connection pool metrics. If our application were using a message broker such as RabbitMQ or a caching product, we’d see additional metrics pertaining to these aspects of the application.
The general naming convention for these metrics is a simple dot notation, where related metrics have common prefixes. For example, all Tomcat-related metrics use the prefix "tomcat".
1.1. Disabling Certain Metrics
To disable one or more metrics is a simple matter of configuration. For example, to remove all tomcat-related metrics, just add the configuration property:
management.metrics.enable.tomcat=false
Restart the application and revisit the /actuator/metrics endpoint and you should see that all tomcat-related metrics are no longer listed.
➜ Undo the above change. i.e. re-enable all metrics.
1.2. Meter Endpoints
Each meter has its own endpoint, whose url follows the pattern /actuator/metrics/${metric_name}. Let’s explore the metric named http.server.requests.
-
Visit the demo application’s
/todosendpoint, the/api/todosendpoint, and the/endpoint (which should return a 404) -
Next, visit http://localhost:8080/actuator/metrics/http.server.requests
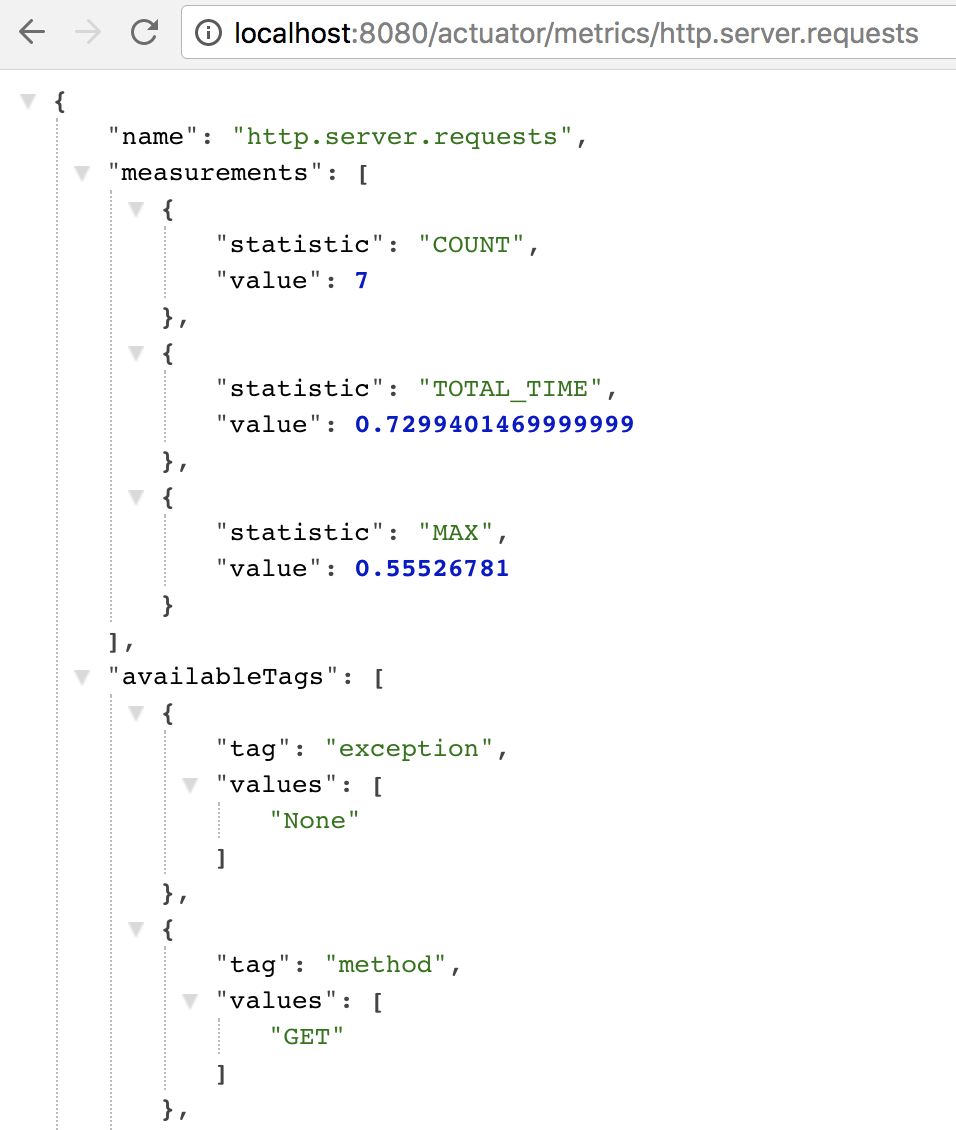
The response contains two main sections: measurements, and availableTags. This meter is a timer, so we see COUNT, TOTAL_TIME, and MAX measurements. Each time the application receives an HTTP request, the count is incremented, the duration is recorded.
The tags make things much more interesting, and add dimensionality to the meter. To get a count of all 404 (not found) requests, use this url: http://localhost:8080/actuator/metrics/http.server.requests?tag=status:404. That is, we don’t create a separate meter, we just count the increment with an associated tag or set of tags. In this fashion we can obtain information about HTTP requests by response code, by HTTP method (GET vs POST for example), by how many threw exceptions, or a combination thereof.
This concept of tags and dimensionality is very powerful.
2. Monitoring with Prometheus
Micrometer supports many different monitoring systems (see https://micrometer.io/docs for a list), including JMX, New Relic, Datadog, Prometheus, Graphite, and more.
Let’s pick and explore Prometheus, a powerful and easy-to-install open-source monitoring solution.
To enable monitoring with Prometheus, we add one runtime dependency to our build:
@@ -29,6 +29,7 @@ dependencies {

   runtime 'com.h2database:h2'
   runtime 'mysql:mysql-connector-java'
+  runtime 'io.micrometer:micrometer-registry-prometheus'

   testCompile 'org.springframework.boot:spring-boot-starter-test'
 }
To integrate with a different monitoring solution, add a different micrometer-registry-${monitoring-solution-name} dependency instead.
Prometheus works by periodically scraping an endpoint on the application it monitors. It expects the response to match a specific format. Micrometer does this for us automatically, by exposing that endpoint:
➜ Restart the application, and visit http://localhost:8080/actuator/prometheus
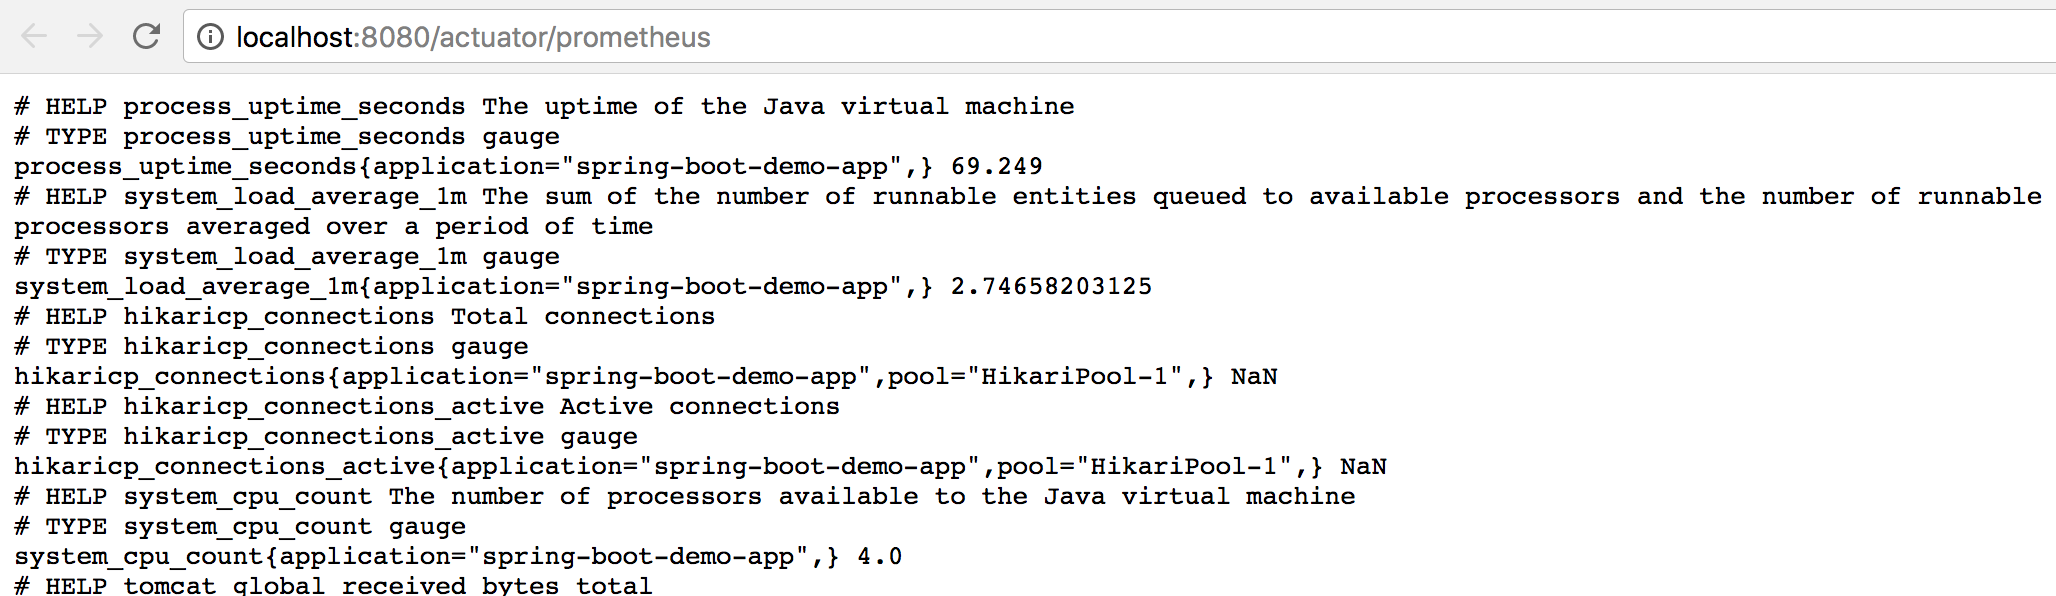
All of the metrics that micrometer manages are now made available to Prometheus in the format it expects. Note how even the names of the meters follow a different convention (underscores instead of dots for keyword separators).
2.1. Install and configure Prometheus
Follow the instructions from the Prometheus Getting Started documentation to install the product.
Next, youll need a configuration for Prometheus to tell it what application to monitor:
global:
  scrape_interval: 15s
  evaluation_interval: 15s
scrape_configs:
  - job_name: 'spring-boot-demo-app'
    scrape_interval: 5s
    metrics_path: '/actuator/prometheus'
    static_configs:
    - targets: ['localhost:8080']
Above, we create a job named spring-boot-demo-app, and instruct Prometheus to scrape our endpoint /actuator/prometheus at localhost:8080 every five seconds.
Save the above file in the directory where prometheus is installed.
2.2. See Metrics In Prometheus
-
Start the application
-
Start prometheus with the command:
$ ./prometheus --config.file=./prometheus.yml -
Visit your application endpoints, perhaps several times:
/,/todos,/hello,/api/todos,/api/todos/3 -
Open a browser window to the Prometheus user interface at http://localhost:9090/
In the Expression text field, enter the value http_server_requests_seconds_count (this is the same metric we were looking at in the previous section), and press Execute.
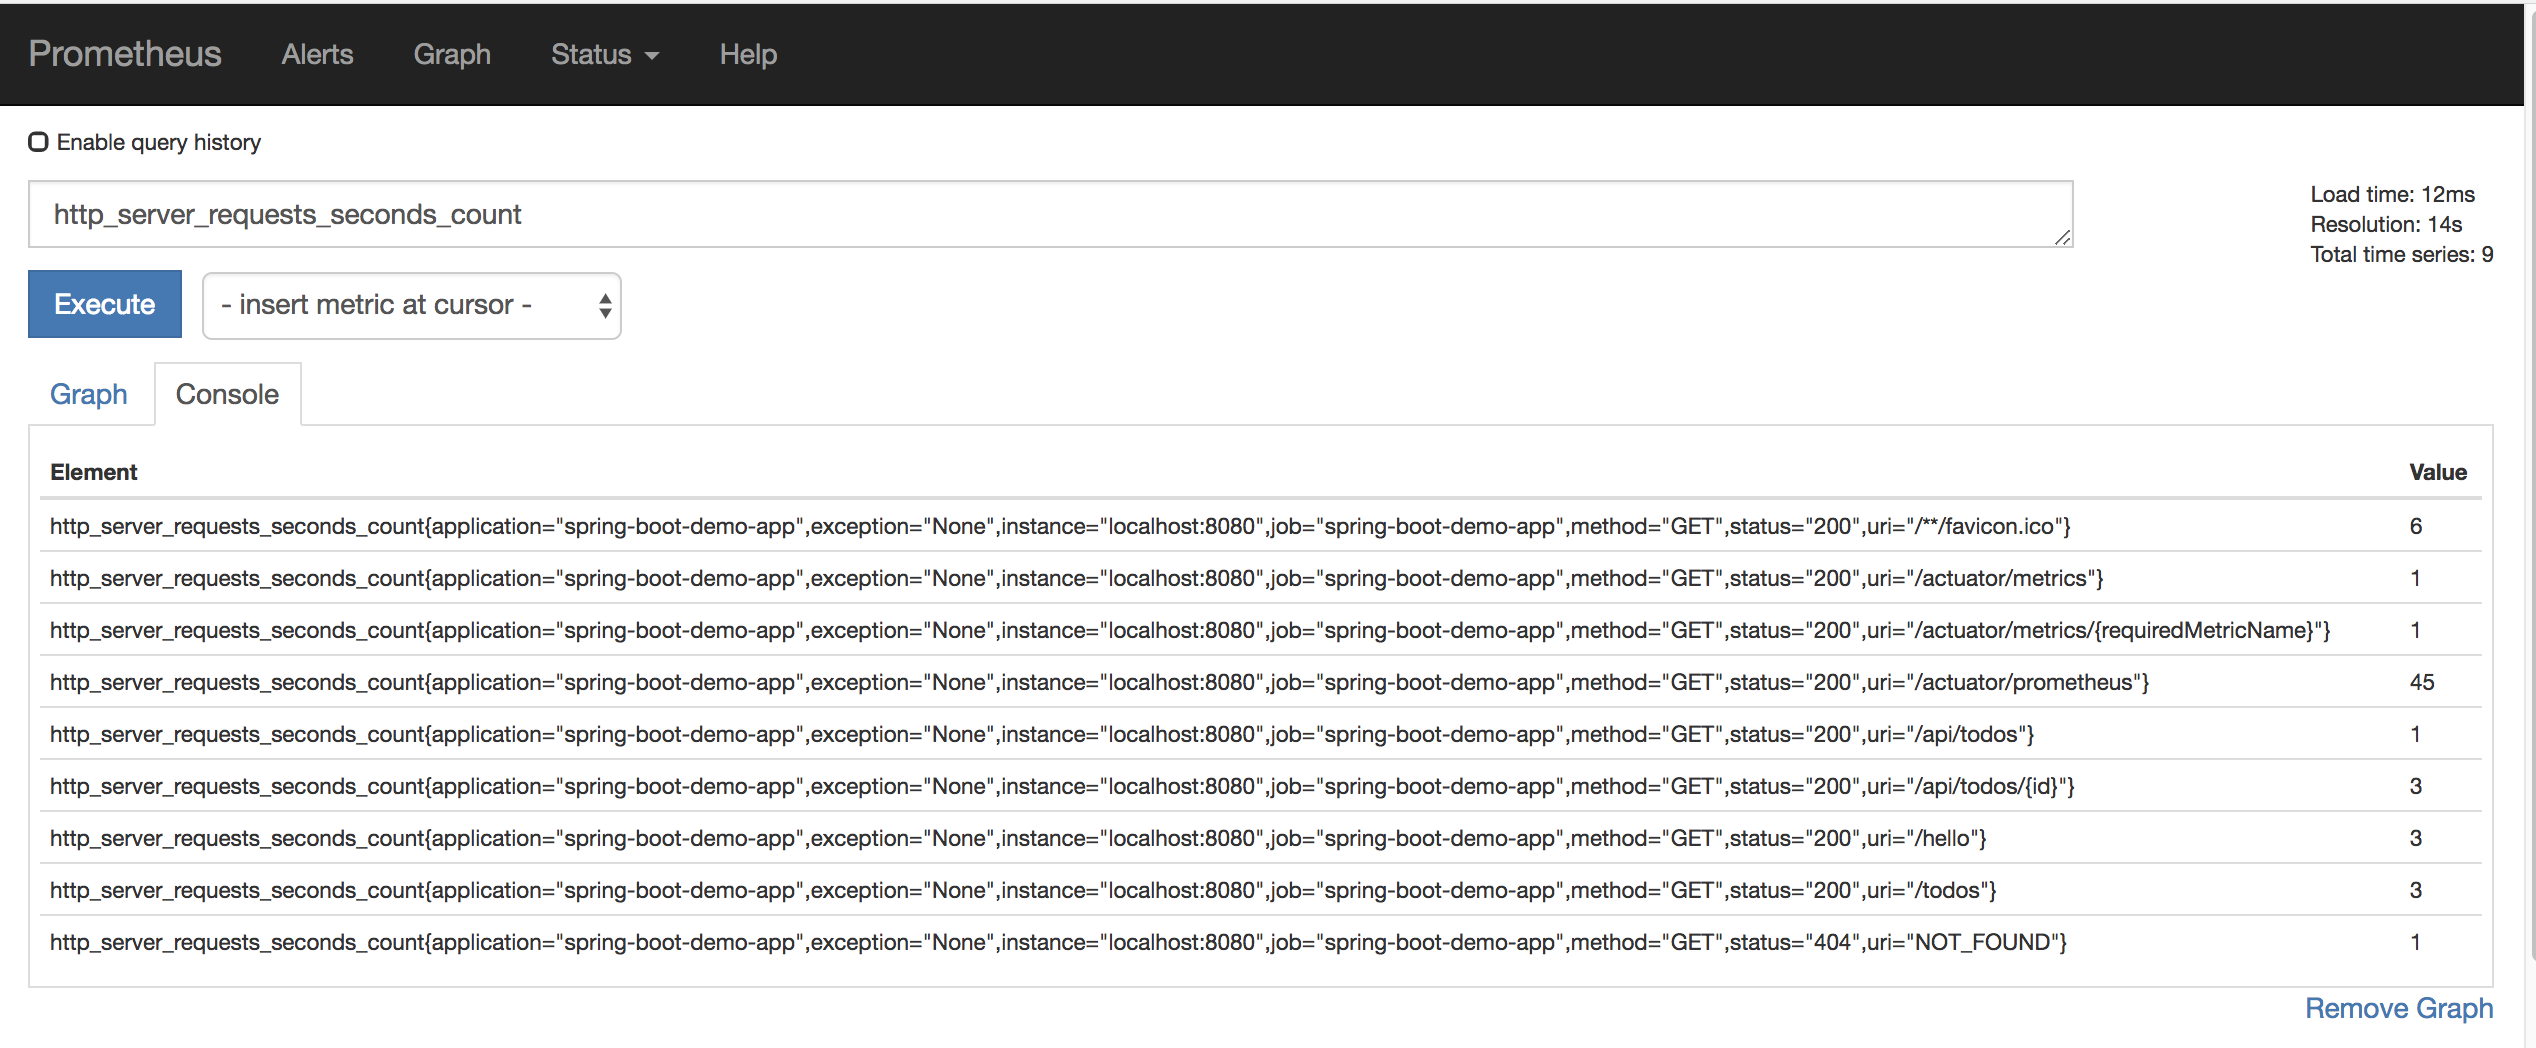
Note how the http requests are broken down by tag: by response status, by endpoint uri, by HTTP method, etc..
Switch to the Graph tab. You’ll see a graph of requests. This is not too interesting. We see Prometheus itself periodically scraping its endpoint to grab the metrics, and that’s increasing linearly, as expected.
In a bash shell, enter the following command, to create a todo entry every second:
$ while :; do http post :8080/api/todos title=todo description="the todo" dueDate="2019-01-01"; sleep 1; done|
Depending on the HTTP client you’re using, you may need to substitute the above $ while :; do curl -XPOST -H"Content-Type: application/json" -d @data.json localhost:8080/api/todos; sleep 1; done Before you can invoke the above, you’ll have to setup a simple |
Given a counter, we can ask Prometheus to compute and graph the rate of incoming HTTP requests to our application, using the following expression:
rate(http_server_requests_seconds_count[30s])
Here’s the resulting graph after a few minutes have elapsed:
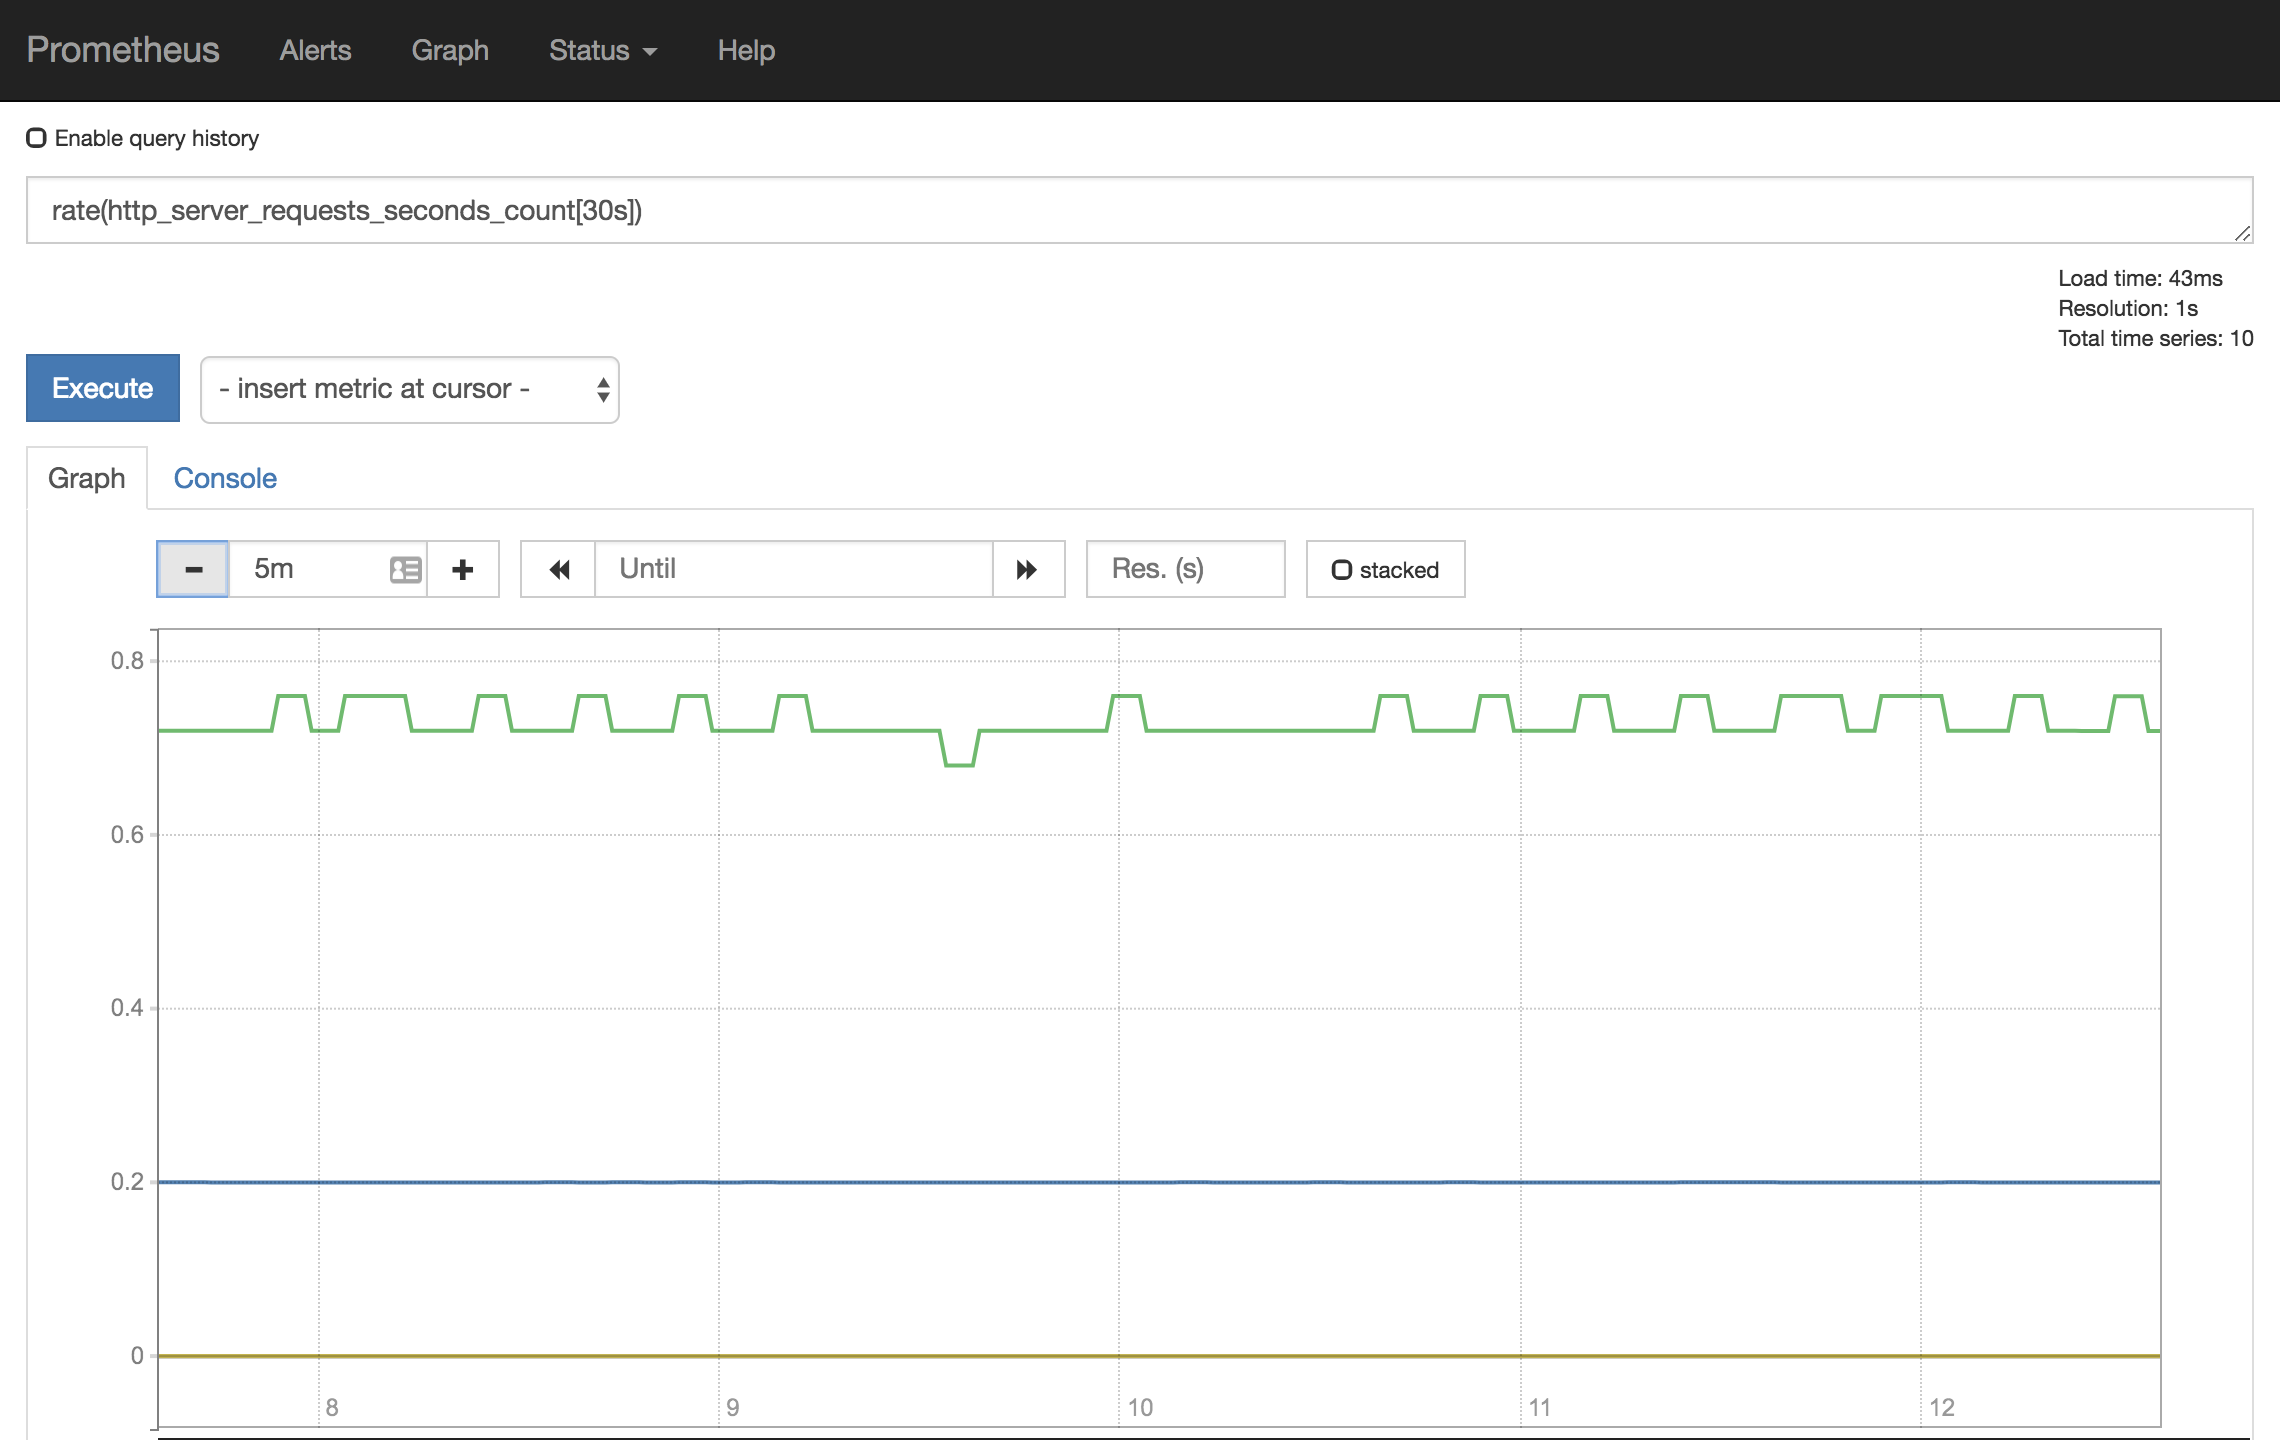
The blue line, at a rate of 0.2 requests per second, is our Prometheus scrape. The green line at the top, running at roughly 0.75 requests per second, is our HTTP POST followed by a sleep of one second.
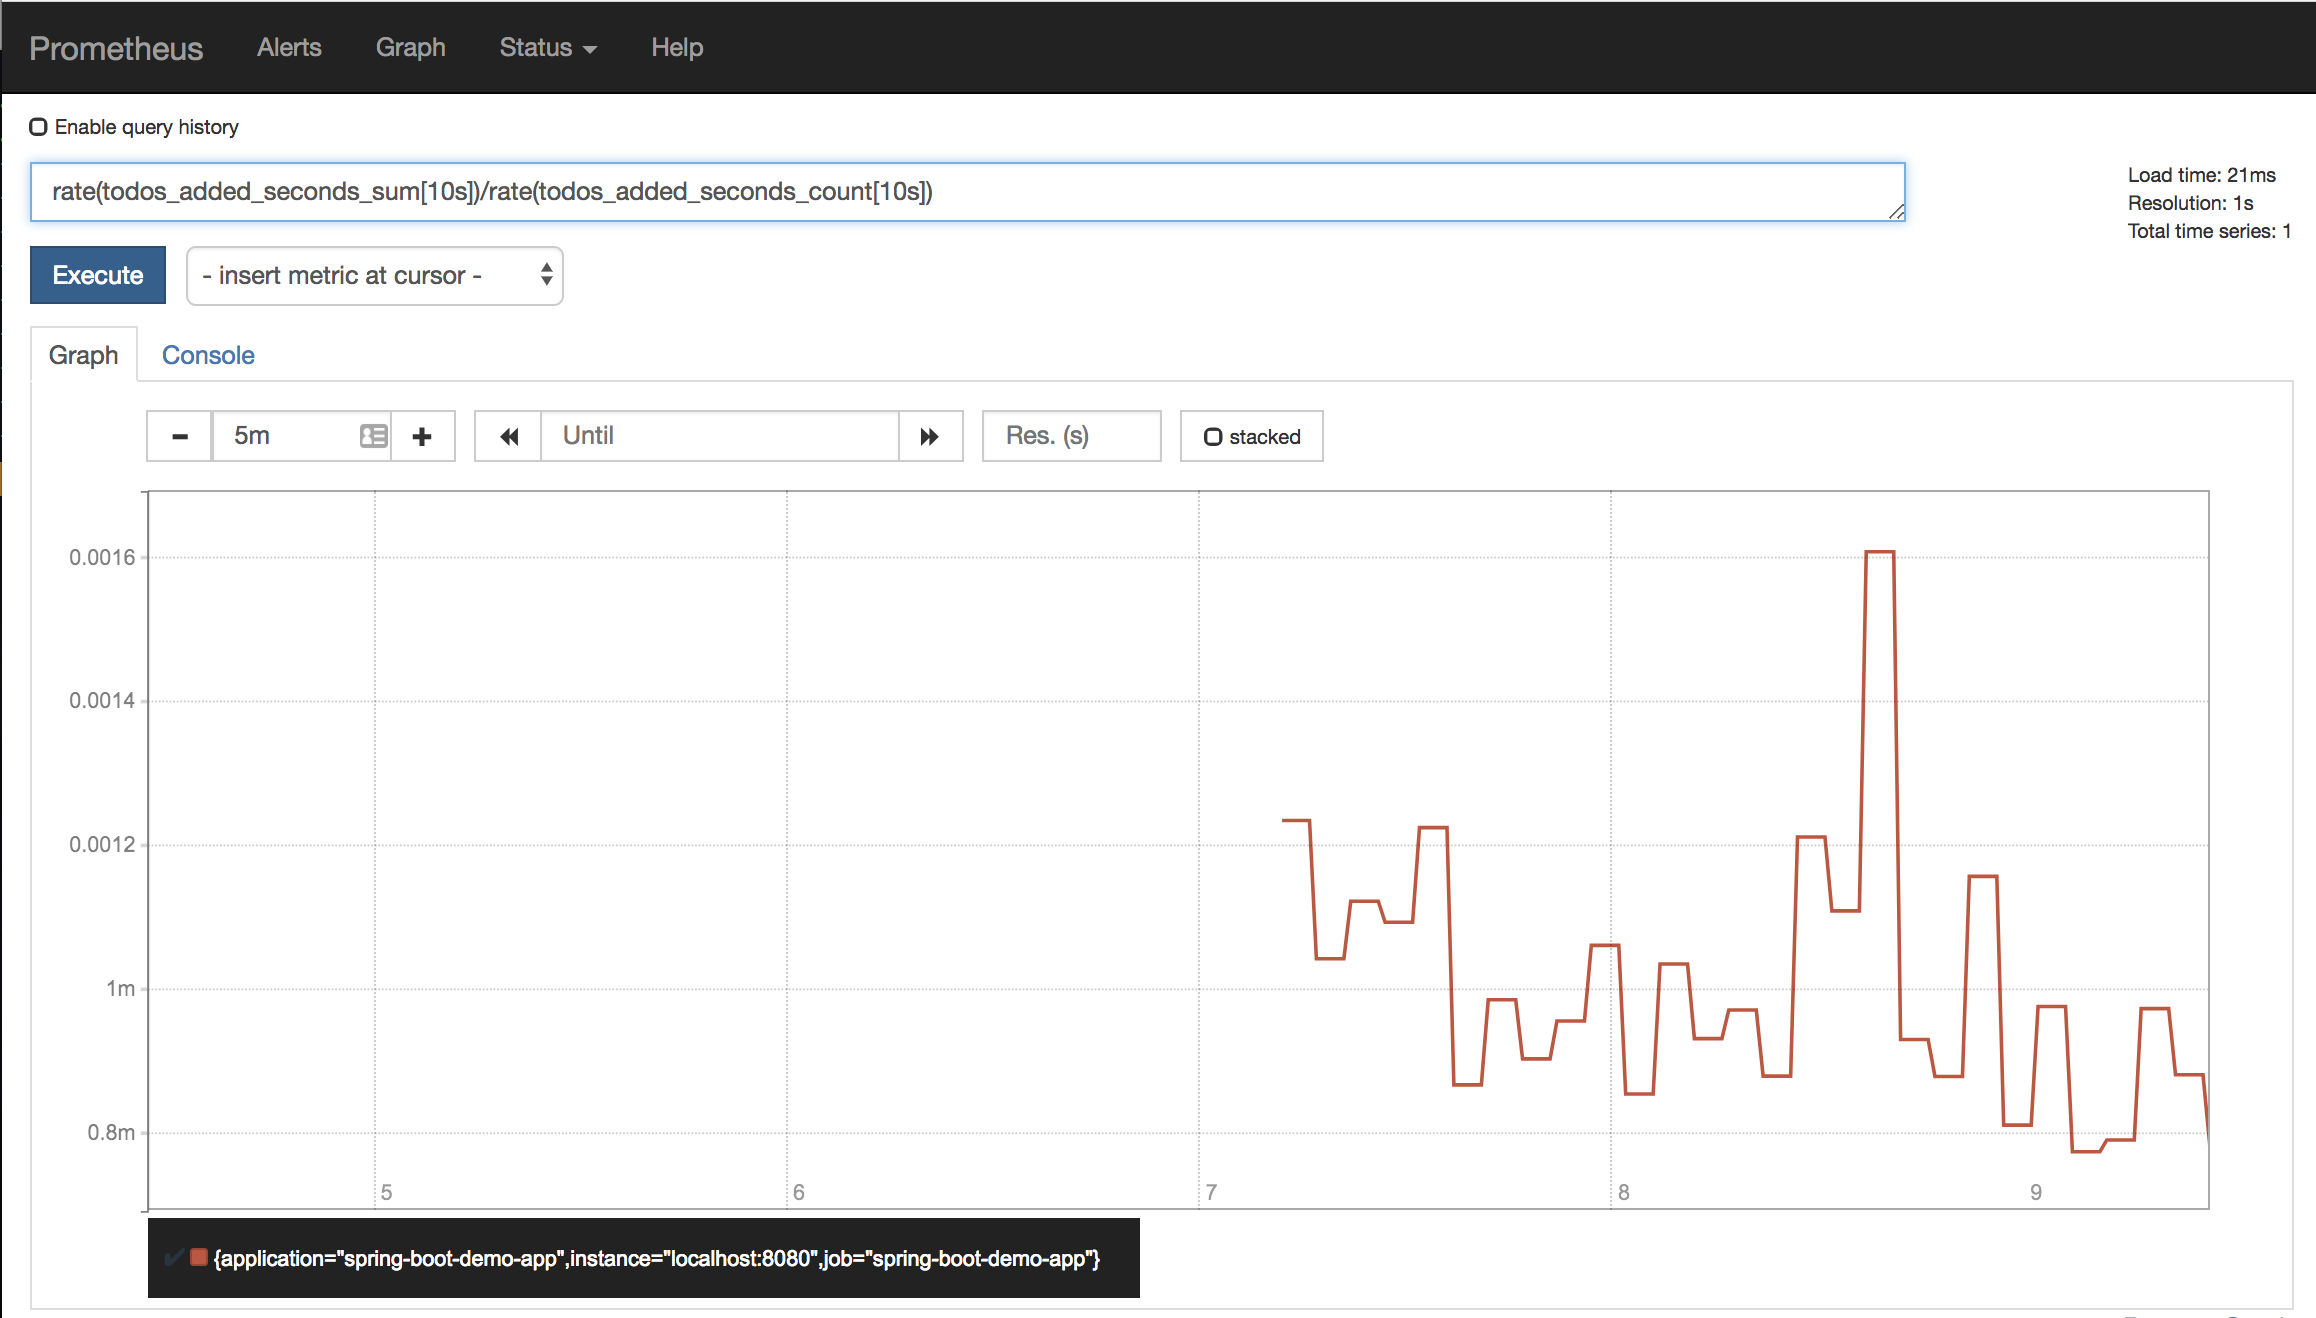
To monitor the average latency of requests, you can use this expression:
rate(http_server_requests_seconds_sum[30s])/rate(http_server_requests_seconds_count[30s])
➜ Use the above expression to produce a graph showing average latency of HTTP requests.
2.3. Grafana Prometheus Dashboard
This section demonstrates how quick and easy it is to begin monitoring a running Spring Boot application’s basic vitals.
Grafana is a tool for creating dashboards with graphs based on data from different sources. It has built-in support for Prometheus. There exists a publically available Grafana dashboard that features JVM metrics collected by micrometer and sent to Prometheus at https://grafana.com/dashboards/4701.
This dashboard requires that we tag each of our metrics with an application name.
-
Give your application a name:
src/main/resources/application.yml@@ -1,4 +1,8 @@ --- +spring: + application: + name: spring-boot-demo-app + logging: level: com.example: DEBUG -
Use the micrometer API to tag every metric with the application name, as follows:
src/main/java/com/example/demo/DemoApplication.java@@ -1,6 +1,9 @@ package com.example.demo; +import io.micrometer.core.instrument.MeterRegistry; +import org.springframework.beans.factory.annotation.Value; import org.springframework.boot.SpringApplication; +import org.springframework.boot.actuate.autoconfigure.metrics.MeterRegistryCustomizer; import org.springframework.boot.autoconfigure.SpringBootApplication; import org.springframework.boot.context.properties.EnableConfigurationProperties; import org.springframework.context.annotation.Bean; @@ -13,4 +16,9 @@ public class DemoApplication { SpringApplication.run(DemoApplication.class, args); } + @Bean + MeterRegistryCustomizer<MeterRegistry> metricsCommonTags(@Value("${spring.application.name}") String appName) { + return registry -> registry.config().commonTags("application", appName); + } + } -
Finally, restart the application
Next:
-
Install Grafana and start it. Its interface should be running at http://localhost:3000/
-
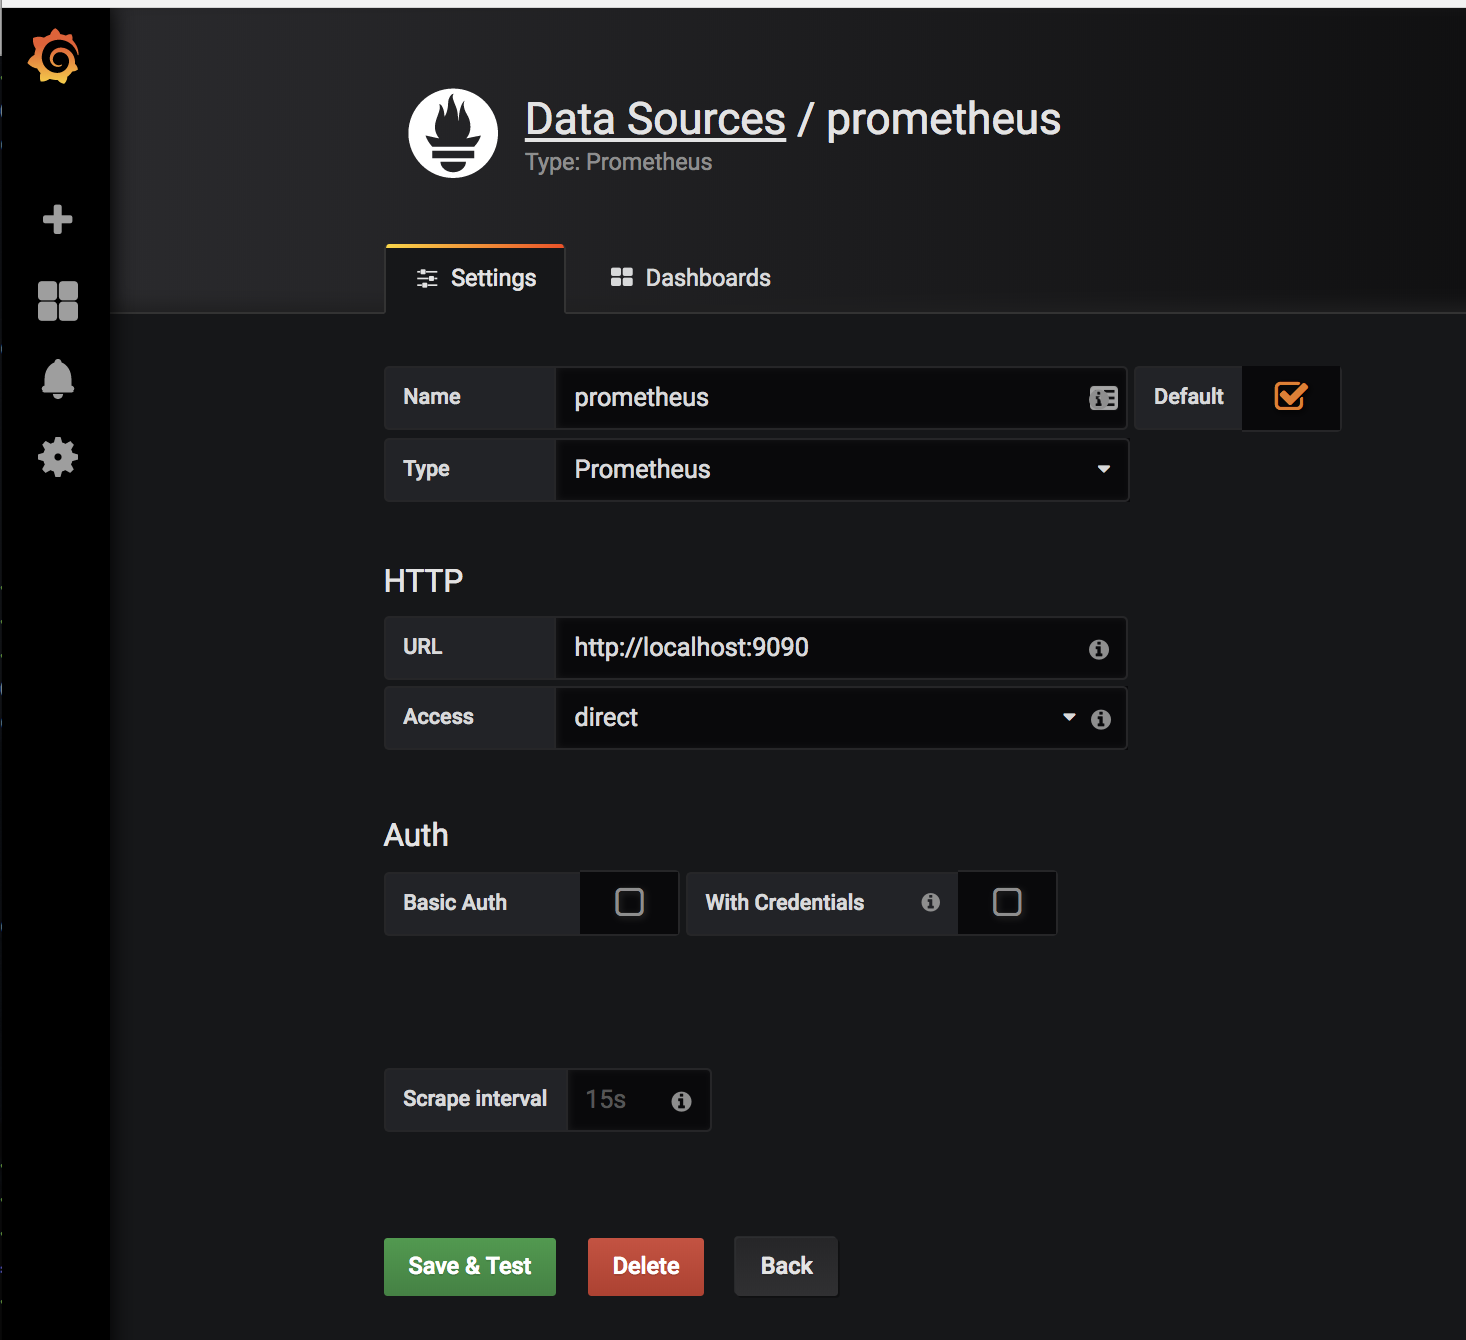
Create a datasource in grafana, of type
Prometheus -
Specify the Prometheus URL of http://localhost:9090/ and direct access.
-
Test and save the datasource
Finally:
-
From the grafana UI, click the '+' button on the left hand side, and select
Import. -
In the text field, enter the dashboard id: 4701 and press Enter.
-
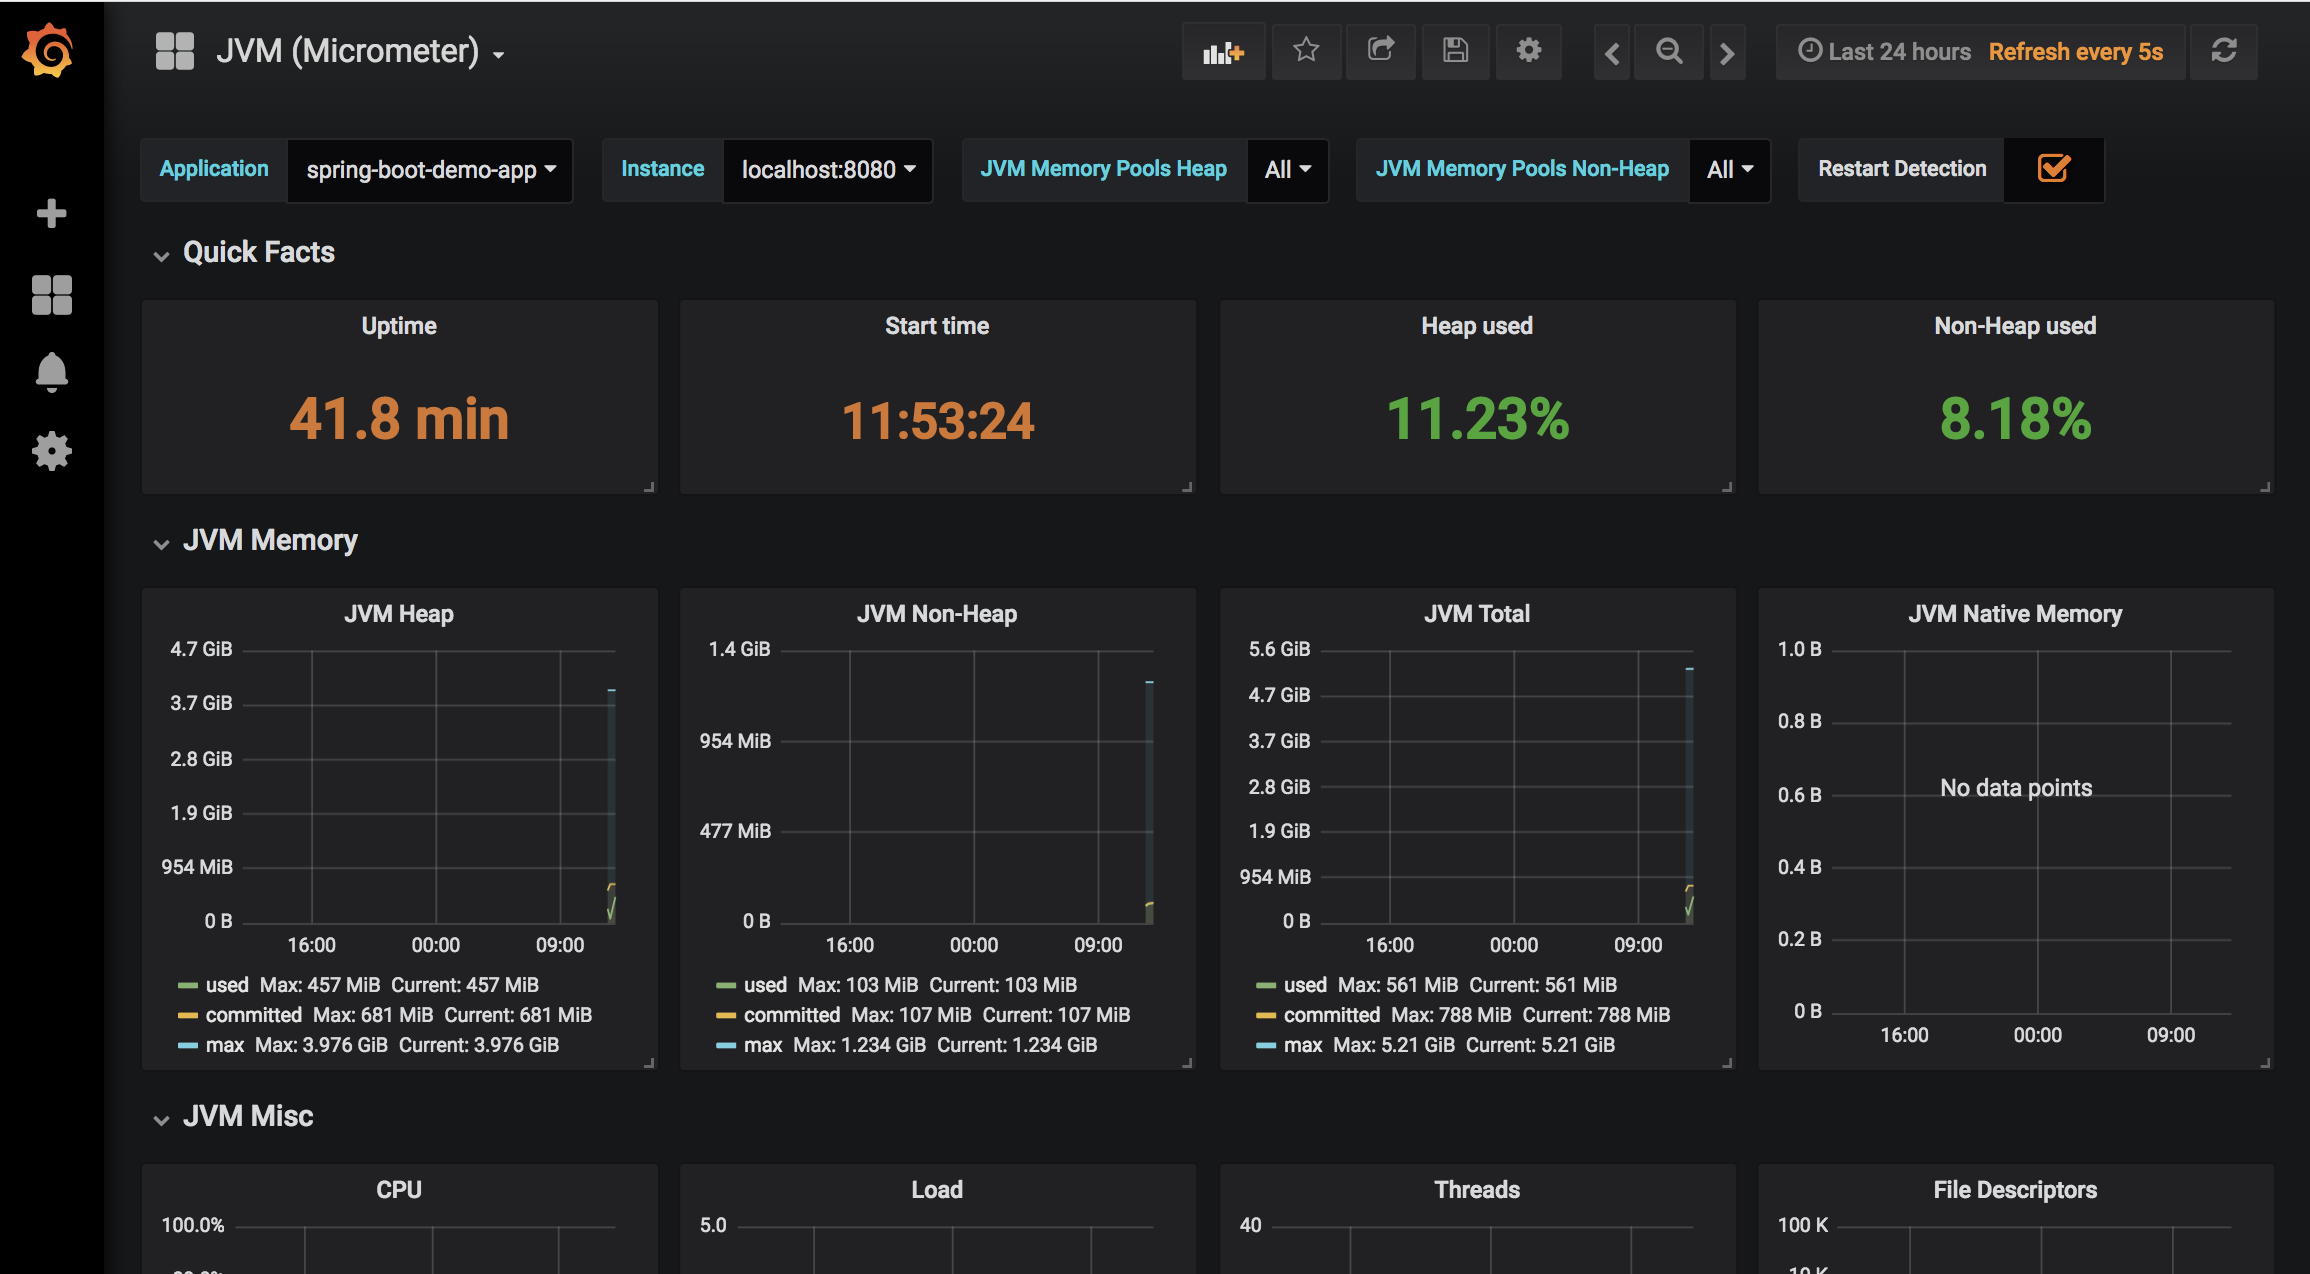
You’ll be prompted to select a datasource (select your prometheus datasource) and a dashboards name
Once dashboard is created, select the application to monitor (spring-boot-demo-app). You should have a dashboard resembling the following screenshot:
3. Add a Custom Metric
In this section, we demonstrate how to contribute domain-specific metrics to the application. For example, we’re going to measure the creation of Todos: the count of Todos created, and how long it takes for Todos to be created. For this we can use a Timer.
3.1. A Service layer
So far when developing the demo application, we’ve not needed a service layer. Now, we’re about to introduce some business logic: timing of todos created.
➜ Introduce a service bean for todos:
package com.example.demo;

import org.springframework.stereotype.Service;

import java.util.List;
import java.util.Optional;

@Service
public class TodoService {

  private final TodoJpaRepository todoRepository;

  public TodoService(TodoJpaRepository todoRepository) {
    this.todoRepository = todoRepository;
  }

  public Todo addTodo(Todo todo) {
    return todoRepository.save(todo);
  }

  public List<Todo> findAll() {
    return todoRepository.findAll();
  }

  public Optional<Todo> findById(Long id) {
    return todoRepository.findById(id);
  }

  public void delete(Todo todo) {
    todoRepository.delete(todo);
  }

  public long count() {
    return todoRepository.count();
  }
}
➜ Retrofit both Runner.java and TodoRestController.java to autowire a TodoService instead of a repository and to perform all todo-related actions via this service bean. This implies calling TodoService.addTodo() instead of save(), and so on.
Once your refactoring is done, re-run the test suite to make sure everything still works as expected.
3.2. Add the timer
➜ Review the following additions to TodoService.java:
@@ -1,5 +1,7 @@
 package com.example.demo;

+import io.micrometer.core.instrument.MeterRegistry;
+import io.micrometer.core.instrument.Timer;
 import org.springframework.stereotype.Service;

 import java.util.List;
@@ -9,13 +11,16 @@ import java.util.Optional;
 public class TodoService {

   private final TodoJpaRepository todoRepository;
+  private final Timer timer;

-  public TodoService(TodoJpaRepository todoRepository) {
+  public TodoService(TodoJpaRepository todoRepository,
+                     MeterRegistry meterRegistry) {
     this.todoRepository = todoRepository;
+    this.timer = meterRegistry.timer("todos.added"); (1)
   }

-  public Todo addTodo(Todo todo) {
-    return todoRepository.save(todo);
+  public Todo addTodo(Todo todo) throws Exception {
+    return timer.recordCallable(() -> todoRepository.save(todo)); (2)
   }

public List<Todo> findAll() {| 1 | We autowire a micrometer MeterRegistry object into our constructor, for the purpose of creating a timer field. We give our timer the name todos.added. |
| 2 | When addTodo() is called, the recordCallable() method wraps the call to todoRepository.save(), giving the timer an opportunity to both count the invocation and to time it (this call can throw an Exception, which requires that we either catch or rethrow it). |
3.3. Monitor the Timer
-
Start the application.
-
Visit the metrics endpoint at http://localhost:8080/actuator/metrics, make sure you see the new metric
todos.addedon the list. -
In a bash shell, enter the following command, to create a todo entry every second:
$ while :; do http post :8080/api/todos title=todo description="the todo" dueDate="2019-01-01"; sleep 1; done -
Visit the metric endpoint http://localhost:8080/actuator/metrics/todos.added. Do you see the COUNT, TOTAL_TIME, and MAX measurements? Refresh the page, the COUNT should be increasing.
-
Start up Prometheus again, and verify that the new timer metrics are available in Prometheus:
todos_added_seconds_count,todos_added_seconds_sum, andtodos_added_seconds_max.
4. Summary
In this lab we reviewed Spring Boot Actuator’s support for metrics and monitoring, and its integration with the new micrometer framework.
We explored monitoring our application using Prometheus and Grafana, and how to add application-specific metrics.
What used to be perhaps a tedious task of figuring out how to instrument your application to be able to monitor it and understand its behavior has become simple and streamlined, irrespective of the monitoring solution you choose to use.
In the next lab we turn our attention to understanding Spring Boot more deeply: how it works internally, and specifically how starters and autoconfiguration work.