Estimated Time: 30 minutes
1. Preface
In this lab, we build on the foundation we’ve picked up from the first lab. We introduce new commands that are essential for developers working with cloudfoundry. You’ll learn how to tail logs, view application events, and scale an application with ease. The last portion of the lab focuses on demonstrating one of the high availability characteristics of the cloud foundry platform: automatic restart of a failed application instance. Enjoy.
2. Exercises
2.1. Push the articulate application
-
Download the
articulateapplication. Copy the file to folder:~/pivotal-cloud-foundry-developer-workshop/articulate/(~is shorthand for the home directory in Linux, Mac and Unix based operating systems). You will need to create this directory in your home directory.If your browser warns you about downloading this file please proceed to download it. Source is not required, but you may be curious how it works as you move through the labs.
-
Push the
articulateapplication.cd ~/pivotal-cloud-foundry-developer-workshop/articulate/cf push articulate -p ./articulate-0.3.jar -m 512M --random-route --no-startNotice how this time, we use the
-pflag to tell thecfcommand what file to upload.
2.2. Access articulate logs
-
Review the documentation on application logging.
-
Tail the logs of the
articulateapplication.cf logs articulate -
Open another terminal window and start the
articulateapplication. Review the output from both terminal windows.cf start articulate -
Open a browser and view the
articulateapplication. Read about our demo application.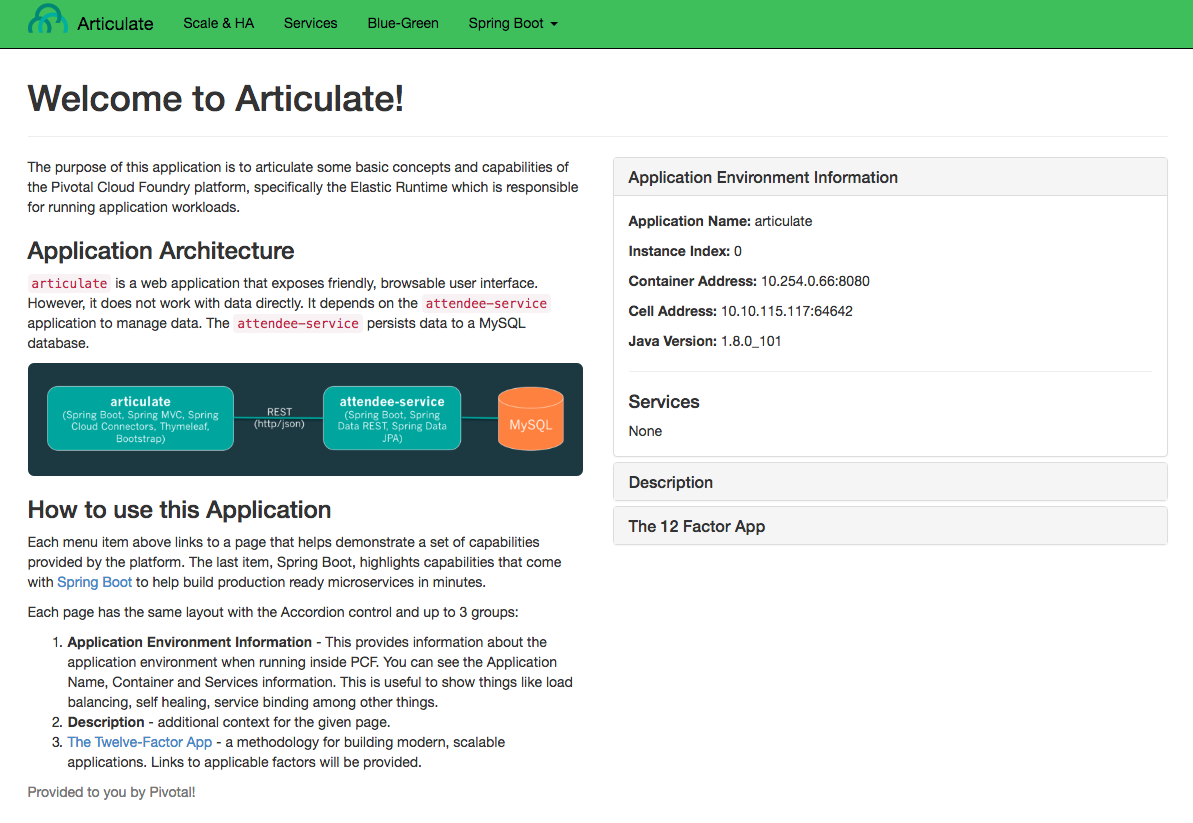
-
Observe the log output when the
articulateweb page is refreshed. More logs are added! -
Stop tailing logs
-
Go to the terminal tailing the logs
-
Send an interrupt (Ctrl+C)
-
2.2.1. Questions
-
Where should your application write logs?
-
What are some of the different origin codes seen in the log?
-
How does this change how you access logs today? At scale?
2.3. Access articulate events
Events for the application can also be used to complement the logs in determining what has occurred with an application.
cf events articulate2.4. Scale articulate
2.4.1. Scale up
-
Start tailing the logs again.
cf logs articulate | grep "API\|CELL"cf logs articulate | findstr "API CELL"The above statement filters only matching log lines from the Cloud Controller and Cell components.
-
In another terminal window scale
articulate.cf scale articulate -m 1G -
Observe log output.
-
Stop tailing the logs.
-
Scale
articulateback to our original settings.cf scale articulate -m 512M
2.4.2. Scale out
-
Browse to the
Scale and HApage of thearticulateapplication.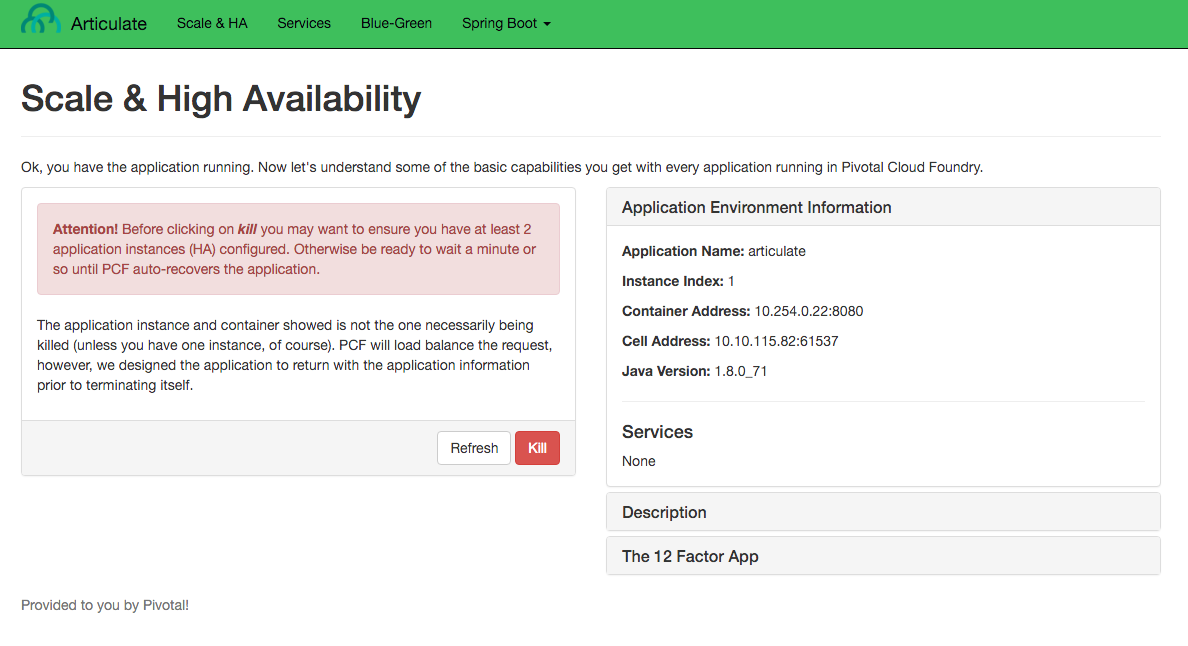
Review the
Application Environment Information. -
Press the
Refreshbutton multiple times. All requests are going to one application instance. -
Start tailing the logs.
cf logs articulate | grep 'API\|CELL'cf logs articulate | findstr "API CELL" -
In another terminal window, scale the
articulateapplication.cf scale articulate -i 3 -
Observe log output. Then stop tailing the logs.
-
Return to
articulatein a web browser. Press theRefreshbutton several times. Observe theAddressesandInstance Indexchanging.
Notice how quickly the new application instances are provisioned and subsequently load balanced!
2.4.3. Questions
-
What is the difference between scaling out versus scaling up?
2.5. High Availability
Pivotal Cloud Foundry has 4 levels of HA (High Availability) that keep your applications and the underlying platform running. In this section, we will demonstrate one of them. Failed application instances will be recovered.
-
At this time you should be running multiple instances of
articulate. Confirm this with the following command:cf app articulate -
Return to
articulatein a web browser (Scale and HApage). Press theRefreshbutton. Confirm the application is running. -
Kill the app. Press the
Killbutton! -
Check the state of the app through the
cfCLI.cf app articulateSample output below (notice the
requested statevs actualstate). In this case, Pivotal Cloud Foundry had already detected the failure and is starting a new instance.requested state: started instances: 3/3 usage: 512M x 3 instances urls: articulate.pcfi1.fe.gopivotal.com last uploaded: Mon Mar 21 20:27:57 UTC 2016 stack: cflinuxfs2 buildpack: java-buildpack=v3.5.1-offline-http://github.com/pivotal-cf/pcf-java-buildpack.git#d6c19f8 java-main open-jdk-like-jre=1.8.0_65 open-jdk-like-memory-calculator=2.0.1_RELEASE spring-auto-reconfiguration=1.10.0_RELEASE state since cpu memory disk details #0 starting 2016-03-21 04:16:23 PM 0.0% 692K of 512M 93.4M of 1G #1 running 2016-03-21 03:28:58 PM 0.5% 410.4M of 512M 158.8M of 1G #2 running 2016-03-21 04:15:57 PM 23.9% 357.8M of 512M 158.8M of 1GRepeat this command as necessary until
state=running. -
In your browser,
Refreshthearticulateapplication.The app is back up!
A new, healthy app instance has been automatically provisioned to replace the failing one.
-
View which instance was killed.
cf events articulate -
Scale
articulateback to our original settings.cf scale articulate -i 1
2.5.1. Questions
-
How do you recover failing application instances today?
-
What effect does this have on your application design?
-
How could you determine if your application has been crashing?
3. Beyond the class
-
Try the same exercises, but using Apps Manager instead
-
Visit the cloud foundry plugins site at https://plugins.cloudfoundry.org/ and investigate the Open plugin.