In this lab, we’ll use Spring Cloud Sleuth to correlate a call trace that starts at the zuul gateway, continues through to the greeting hystrix application, and on to the fortune service, and back. We’ll also use Zipkin to visualize a distributed trace.
It’s worthwhile taking a little time to familiarize yourself with distributed tracing terminology.
1. Add the Zipkin Client dependency to our services
Add this dependency to each of the three applications: zuul-gateway, greeting-hystrix, and fortune-service:
<dependency>
  <groupId>org.springframework.cloud</groupId>
  <artifactId>spring-cloud-starter-zipkin</artifactId>
</dependency>
This dependency does two things:
-
it instruments calls across multiple microservices so that log messages have trace and span id’s which can be used to correlate these calls
-
it sends trace and span information to a zipkin collector service.
Next, configure these applications to send 100% of their traces to zipkin, by adding this parameter to each application’s application.yml file:
spring:
  sleuth:
    sampler:
      percentage: 1.0
2. Setup a Zipkin Collector application to visualize traces
Follow the quick-start instructions for Zipkin to stand up a java zipkin server on port 9411.
3. Start up "all the things"
As usual, let’s stand up our system, starting with:
-
config-server
-
service-registry
-
the above zipkin server
Then our services:
-
fortune-service
-
greeting-hystrix
And finally our edge service:
-
zuul-gateway
Let’s make sure that everything is working as intended:
-
Visit the fortune-service a few times in a browser
-
Visit the greeting application a few times and make sure it can connect to the fortune service to render fortunes
-
Visit the same greeting app, but this time via our zuul gateway. Refresh the page 3-4 times for good measure.
4. Check out the Zipkin Server UI
Visit the Zipkin UI in a browser. You might have to wait up to a minute. Since our applications have been configured with the zipkin client dependency, they will attempt by default to send their trace data to the zipkin server.
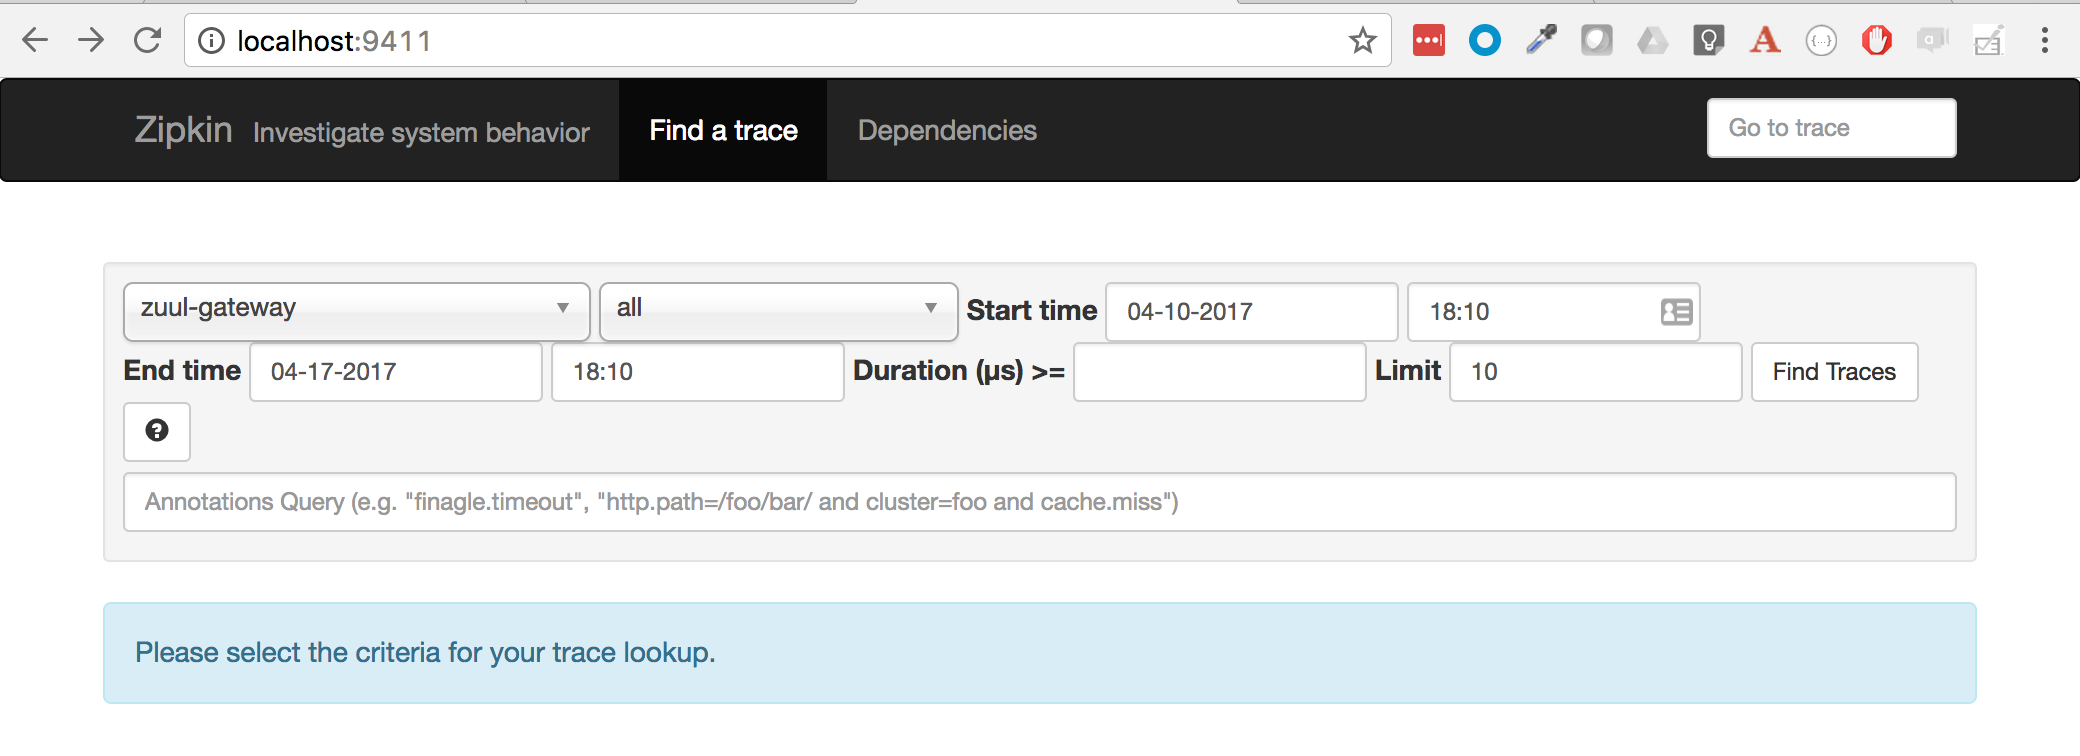
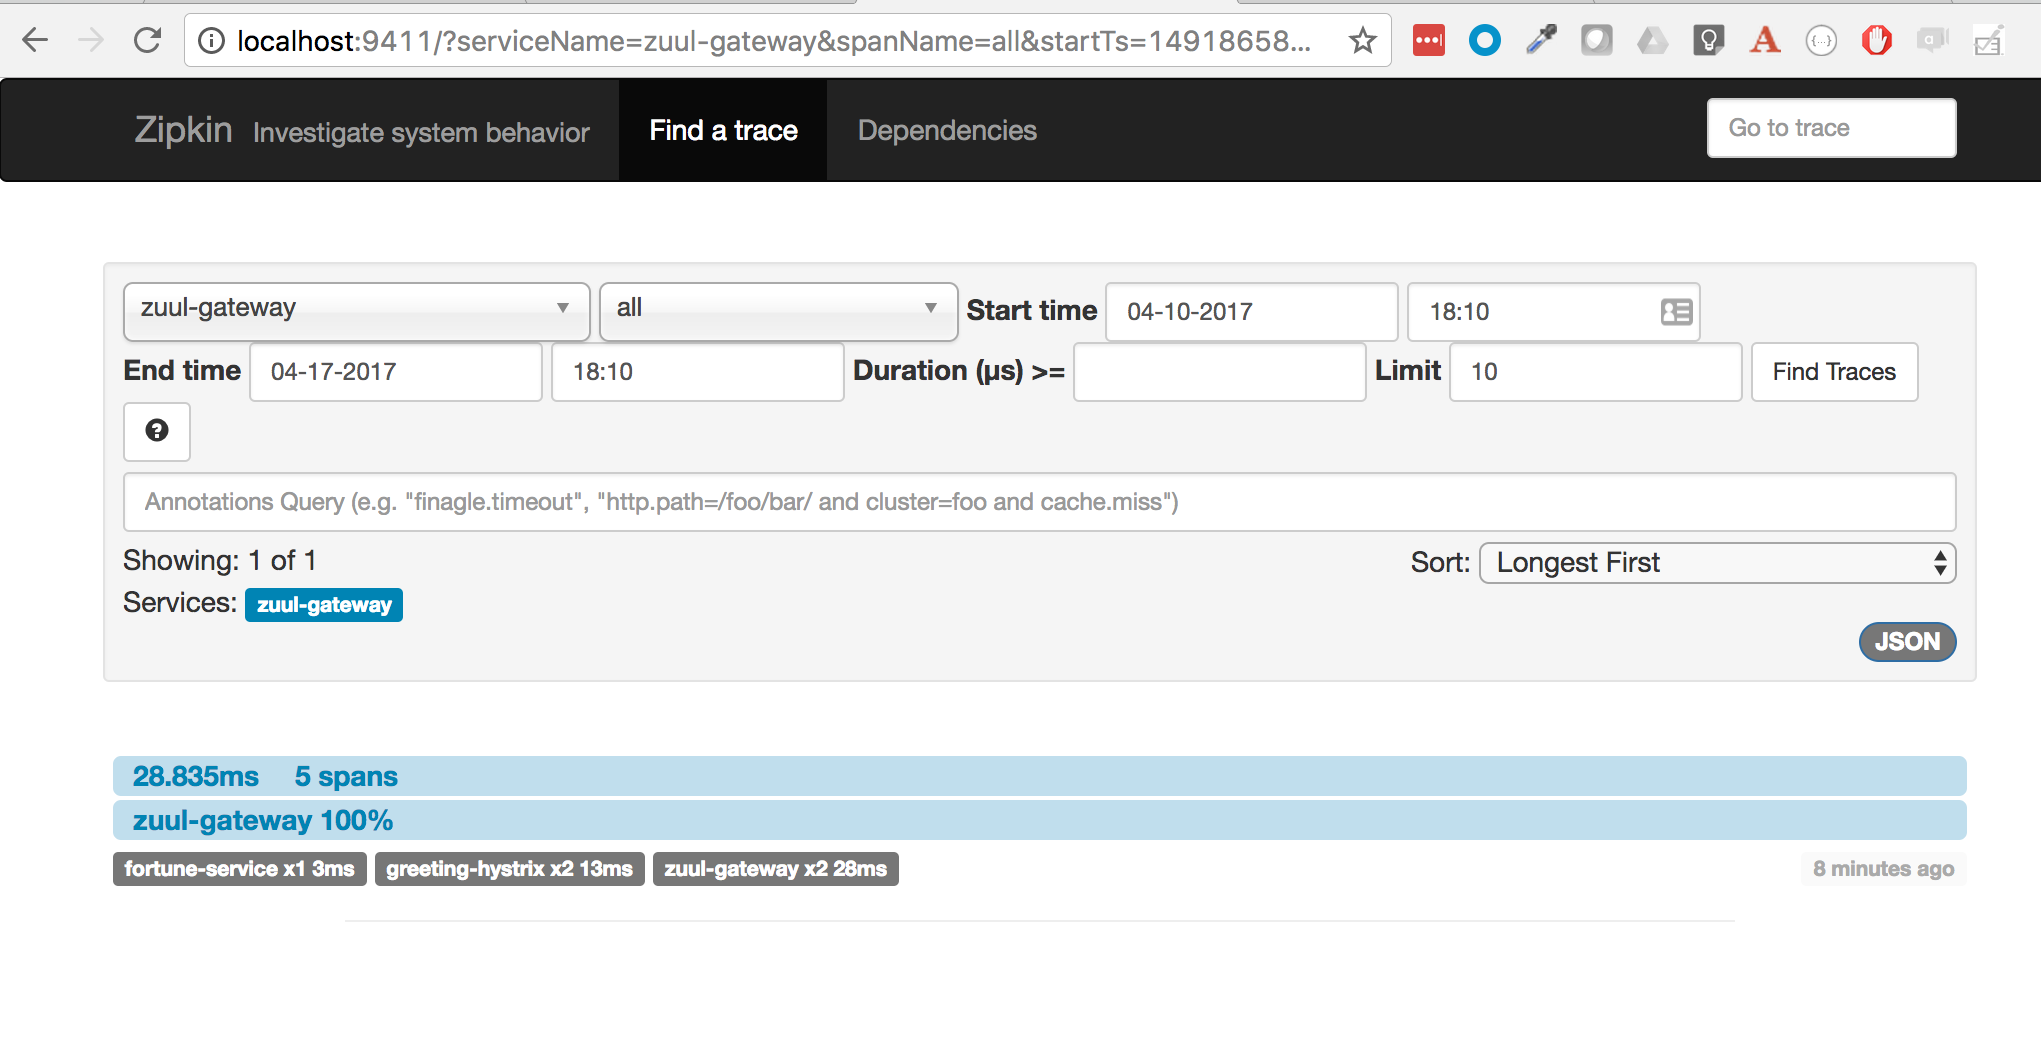
From the pulldown menu, select the zuul-gateway service, and click Find Traces. The search results should display a trace of the "end-to-end" call across all three services, as shown below.
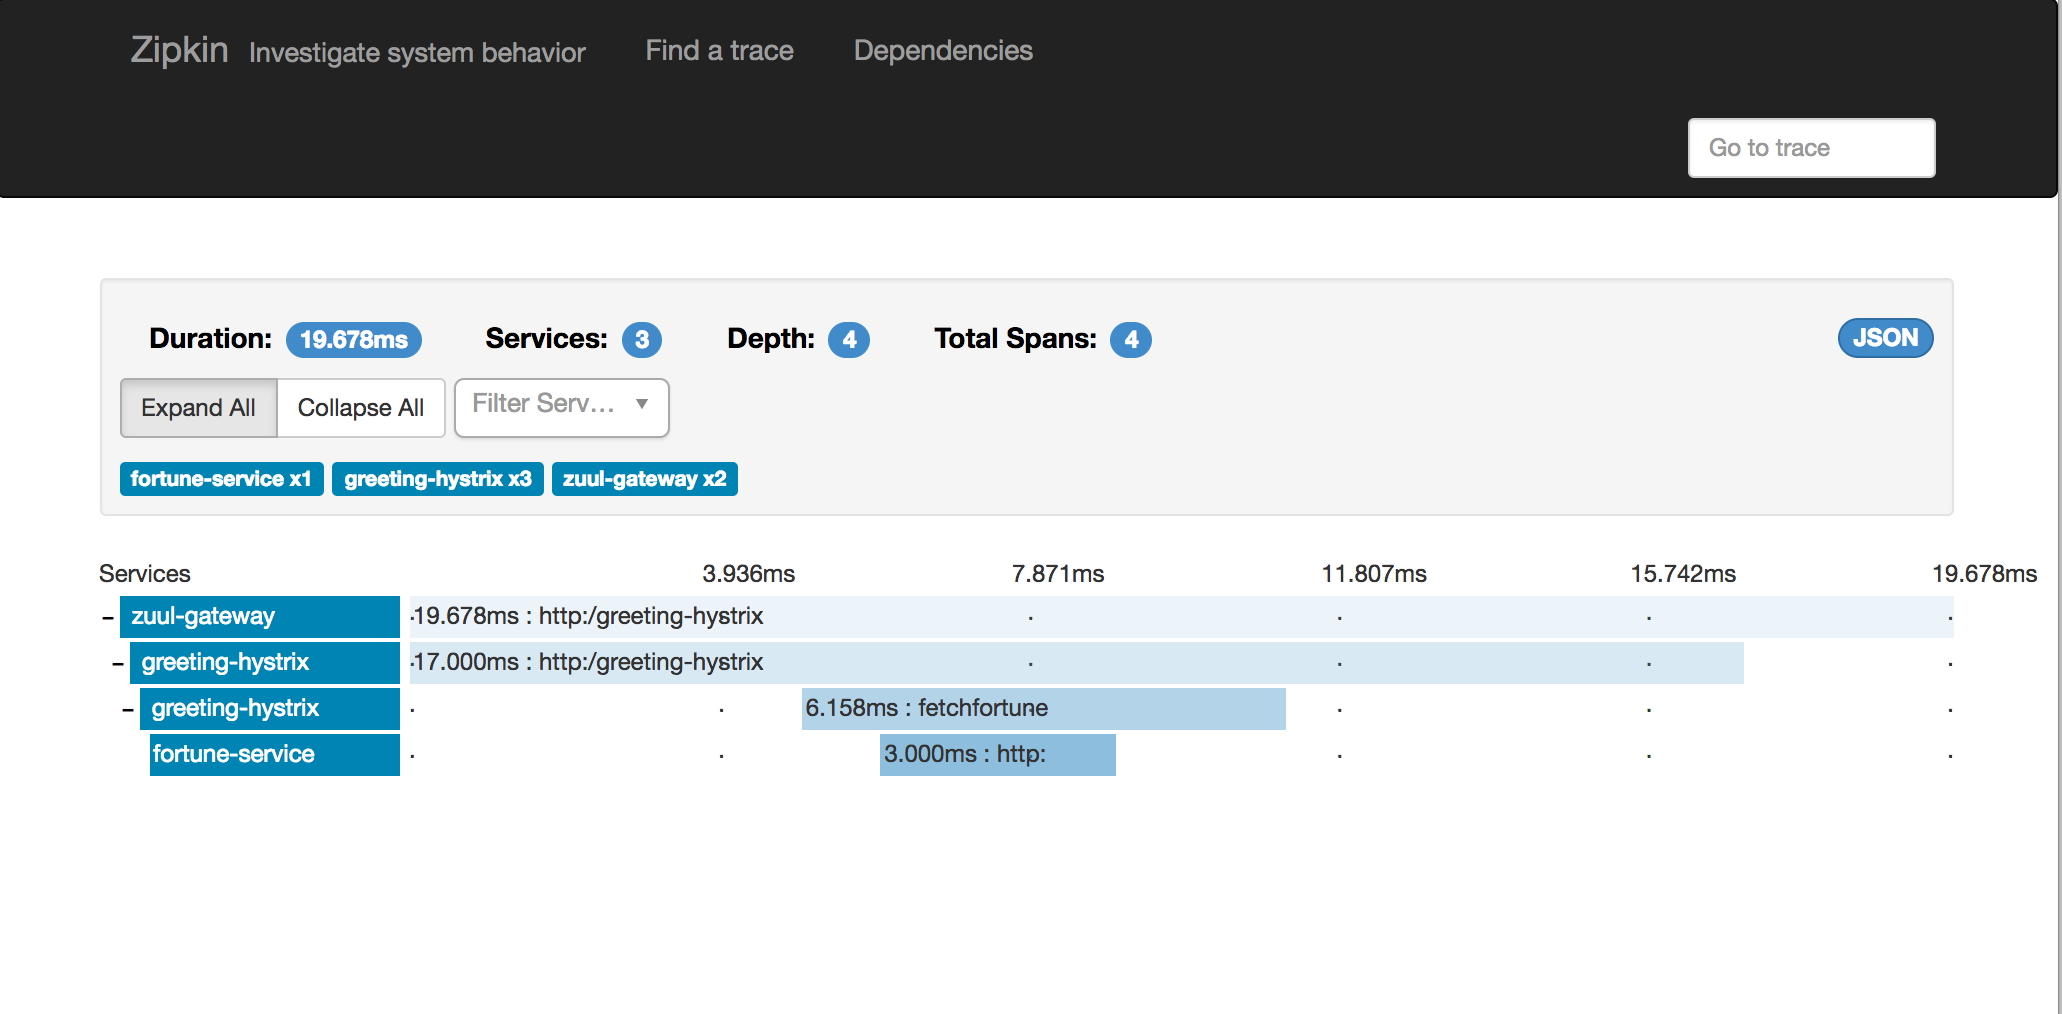
Now, drill down into that trace by clicking on the listed trace, and you should see a visualization similar to the one shown here:
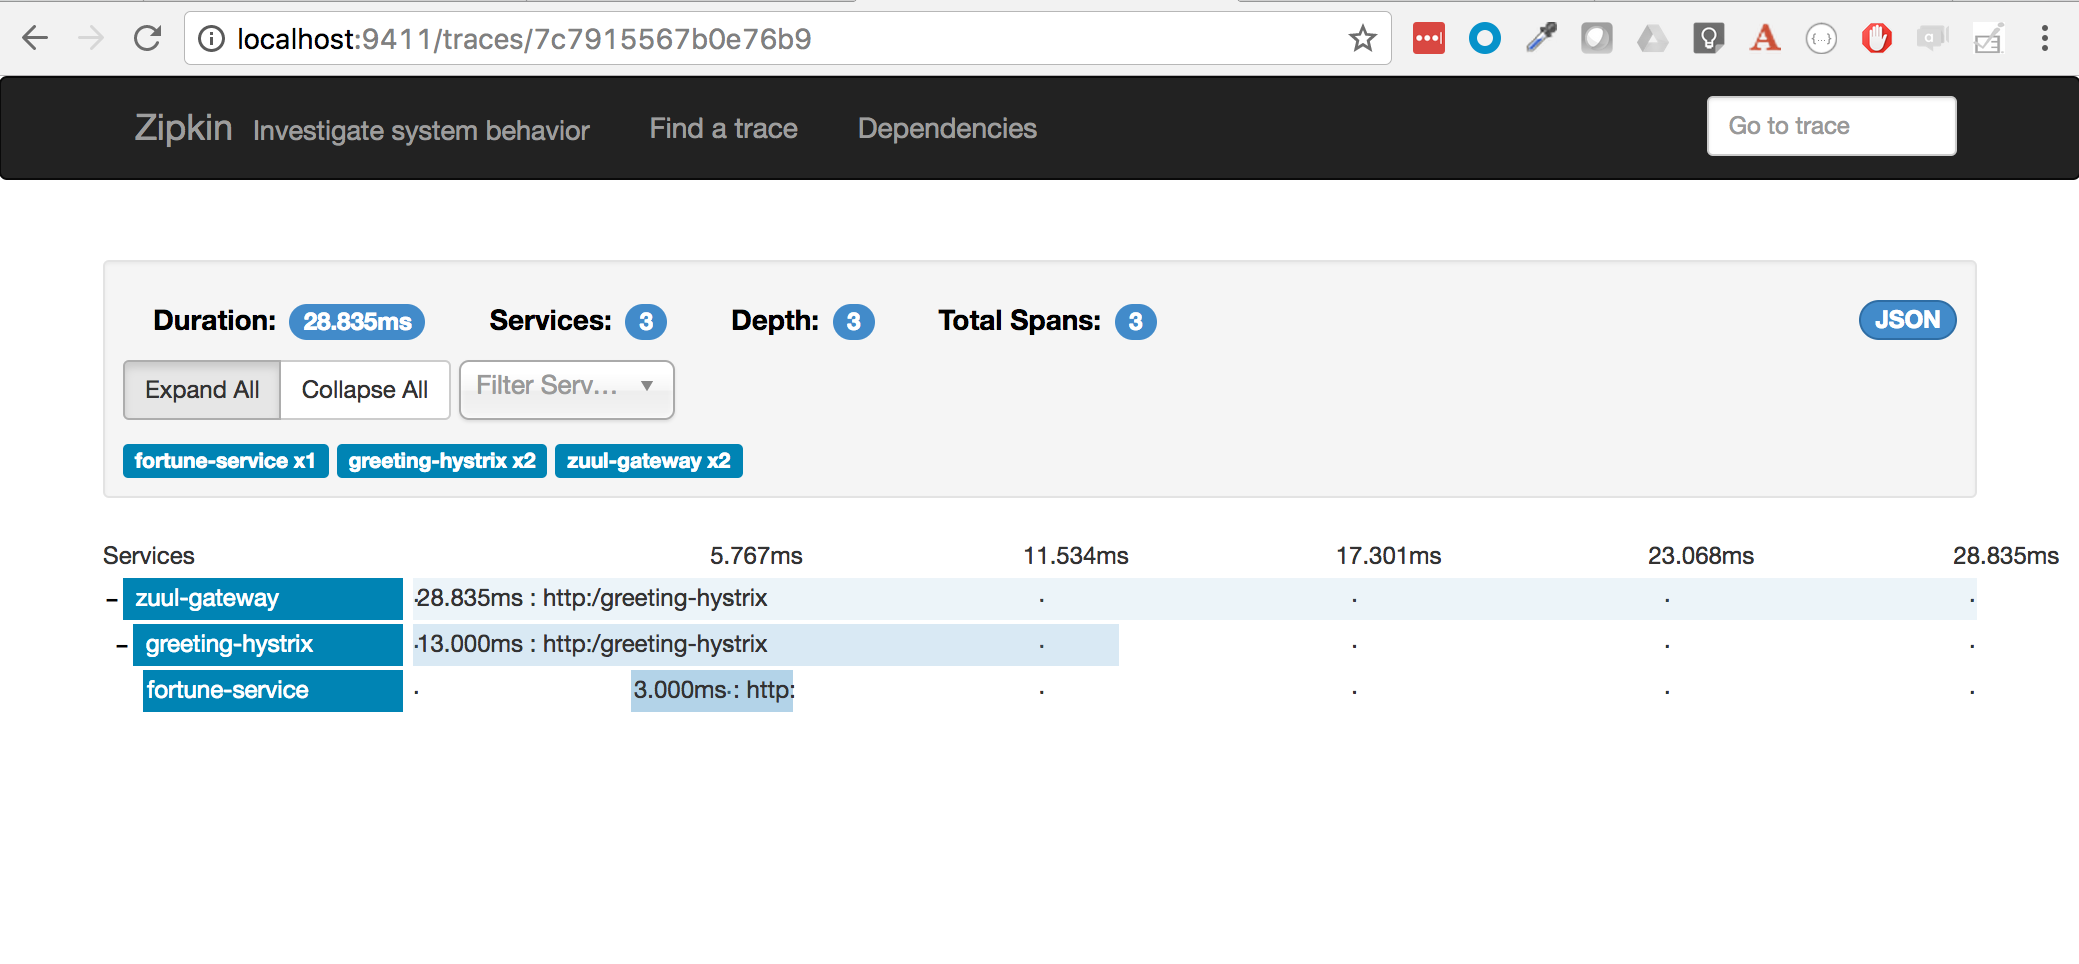
Aside from the basic call trace, note that call duration information is displayed (e.g. 3ms spent in the fortune service). Also, there’s color-coding at play: any calls that throw an exception will display in dark red instead of blue (which signifies a successful call). Clicking on the trace will display a popup window containing even more information about this trace.
As the number of microservices in our ecosystem grows, such trace visualizations become indispensable to help make sense of our system’s behavior. Second, it also allows us to study durations and how much time is spent inside each microservice. It becomes a tool for troubleshooting latency.
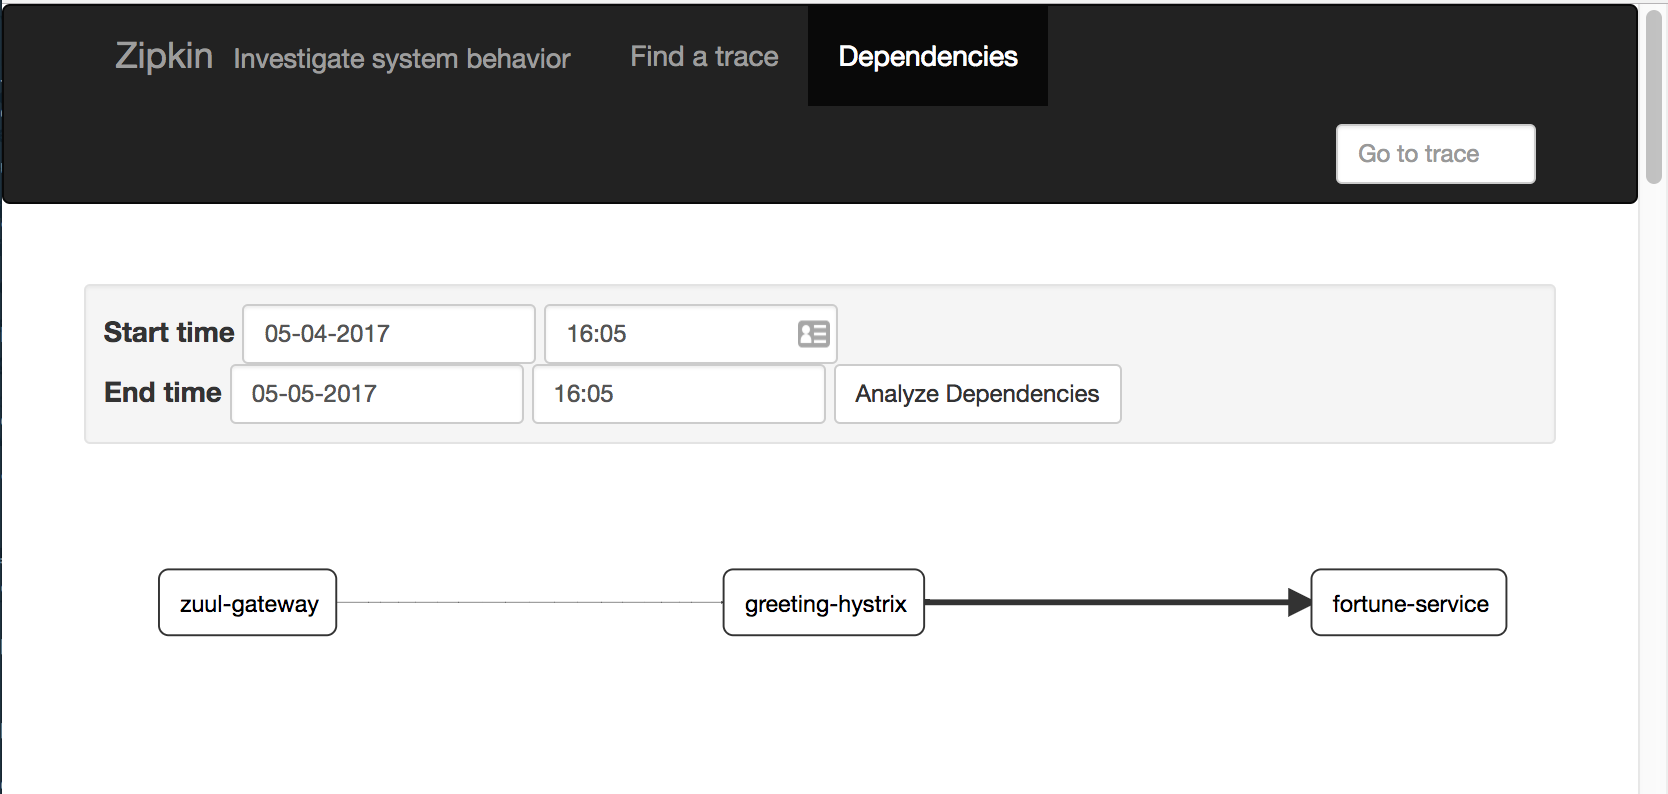
Click on the Dependencies tab in the header. You should see a visualization of the call graph, similar to this:
5. Write a Custom Span
Let’s assume that we wish to know precisely how long the GreetingController in greeting-hystrix takes to fetch a fortune. We can do this by wrapping the call to fortuneService.getFortune() in a custom span.
Do the following:
-
In
greeting-hystrix, navigate toGreetingController -
Refactor: extract the call to
fortuneService.getFortune()into a separate (new) method, called fetchFortune() -
Autowire a spring cloud sleuth
Tracerbean into your controller -
Enhance the new method
fetchFortuneto use the tracer to create a new span namedfetchFortune, and to close that span in atry/finallyclause after the invocation togetFortune()
The finished implementation of GreetingController should look like this:
package io.pivotal.greeting;

import io.pivotal.fortune.FortuneService;
import org.slf4j.Logger;
import org.slf4j.LoggerFactory;
import org.springframework.cloud.sleuth.Span;
import org.springframework.cloud.sleuth.Tracer;
import org.springframework.stereotype.Controller;
import org.springframework.ui.Model;
import org.springframework.web.bind.annotation.RequestMapping;

@Controller
public class GreetingController {

  private final Logger logger = LoggerFactory.getLogger(GreetingController.class);

  private final FortuneService fortuneService;
  private final Tracer tracer;

  public GreetingController(FortuneService fortuneService, Tracer tracer) {
    this.fortuneService = fortuneService;
    this.tracer = tracer;
  }

  @RequestMapping("/")
  String getGreeting(Model model) {

    logger.debug("Adding greeting");
    model.addAttribute("msg", "Greetings!!!");

    String fortune = fetchFortune();

    logger.debug("Adding fortune");
    model.addAttribute("fortune", fortune);

    return "greeting"; // resolves to the greeting.ftl template
  }

  private String fetchFortune() {
    Span span = tracer.createSpan("fetchFortune");
    try {
      return fortuneService.getFortune();
    } finally {
      tracer.close(span);
    }
  }

}
Now do the following:
-
stop and re-run the revised
greeting-hystrixapplication -
visit the zuul
greeting-hystrixendpoint a few times, and finally -
pull up the distributed trace in the zipkin server
You should now see an additional span named fetchFortune displayed in the trace, like this:
The sleuth API also provides ways to:
-
log specific events in the process of handling a request, so that timings can be collected around durations between events, and
-
tag spans with specific keywords, so that they can be searched for and easily found in the zipkin ui.
To learn more about this project, here’s a great presentation given at the devoxx Poland conference in 2016 by Marcin Grzejszczak on Spring Cloud Sleuth and Zipkin.
Congratulations! You’ve completed this lab.