1. What You Will Learn
-
How to aggregate multiple metric streams with
turbine -
How to use Turbine in Pivotal Cloud Foundry
2. Start "all the things"
-
Start the
config-serverin a terminal window. You may have terminal windows still open from previous labs. They may be reused for this lab.$ cd config-server $ mvn spring-boot:run -
Start the
service-registry$ cd service-registry $ mvn spring-boot:run -
Start the
fortune-service$ cd fortune-service $ mvn spring-boot:run -
Start the
greeting-hystrix$ cd greeting-hystrix $ mvn spring-boot:runNext, start a second instance of
greeting-hystrixon port 8081Mac, Linux:
SERVER_PORT=8081 mvn spring-boot:runWindows:
$ set SERVER_PORT=8081 $ mvn spring-boot:run -
Start the
hystrix-dashboard$ cd hystrix-dashboard $ mvn spring-boot:run
Allow a few moments for greeting-hystrix and fortune-service to register with the service-registry.
3. Set up turbine
Looking at individual application instances in the Hystrix Dashboard is not very useful in terms of understanding the overall health of the system. Turbine is an application that aggregates all of the relevant /hystrix.stream endpoints into a combined /turbine.stream for use in the Hystrix Dashboard.
-
Review the
turbine/pom.xmlfile. By addingspring-cloud-starter-turbineto the classpath this application is eligible to aggregate metrics via Turbine.<dependency> <groupId>org.springframework.cloud</groupId> <artifactId>spring-cloud-starter-turbine</artifactId> </dependency> -
Review the following file:
turbine/src/main/java/io/pivotal/TurbineApplication.java. Note the use of the@EnableTurbineannotation. This creates a turbine application.package io.pivotal; import org.springframework.boot.SpringApplication; import org.springframework.boot.autoconfigure.SpringBootApplication; import org.springframework.cloud.netflix.turbine.EnableTurbine; @SpringBootApplication @EnableTurbine public class TurbineApplication { public static void main(String[] args) { SpringApplication.run(TurbineApplication.class, args); } } -
Review the following file:
turbine/src/main/resources/bootstrap.yml.turbine.appConfigis a list of EurekaserviceIdsthat Turbine will use to lookup instances.turbine.aggregator.clusterConfigis the Turbine cluster these services belong to (how they will be grouped).server: port: 8585 spring: application: name: turbine turbine: aggregator: clusterConfig: GREETING-HYSTRIX appConfig: greeting-hystrix -
Open a new terminal window. Start the
turbineapp$ cd turbine $ mvn spring-boot:run -
Wait for the
turbineapplication to register withservice-registry. -
View the turbine stream in a browser http://localhost:8585/turbine.stream?cluster=GREETING-HYSTRIX
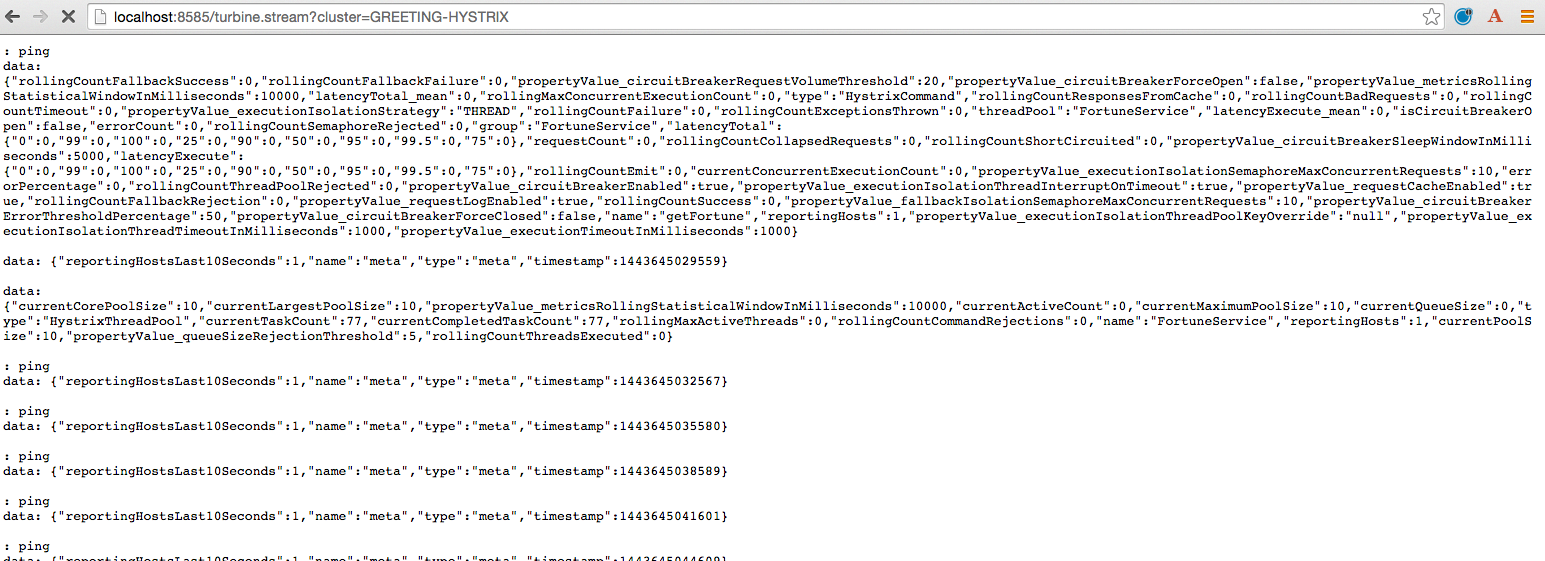
-
Configure the
hystrix-dashboardto consume the turbine stream. Enterhttp://localhost:8585/turbine.stream?cluster=GREETING-HYSTRIX -
Experiment! Refresh the
greeting-hystrixroot endpoint several times. Take down thefortune-serviceapp. What does the dashboard do? -
Notice how the hystrix dashboard’s
getFortunecircuit reflects that it’s monitoring two hosts, as shown here: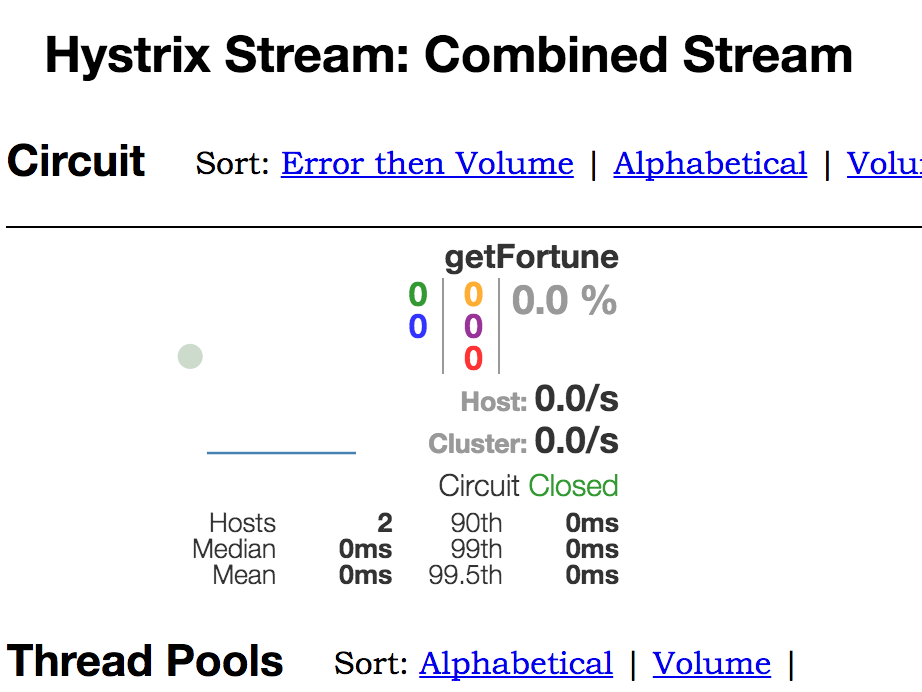
-
When done, stop the
config-server,service-registry,fortune-service,greeting-hystrix,hystrix-dashboardandturbineapplications.
4. Deploying to PCF
In PCF, the traditional Turbine model of pulling metrics from all the distributed Hystrix enabled applications via HTTP doesn’t work when using the route registrationMethod. Read here for more details on registration methods.
When applications register using the route method every application has the same hostname (every app instance has the same URL for a given app). Therefore it is unknown from the Turbine perspective if all metrics are properly being collected. The problem is solved with Turbine AMQP. Metrics are published through a message broker. We’ll use RabbitMQ.
5. Deploy greeting-hystrix to PCF
-
Create a Circuit Breaker Dashboard Service Instance
cf create-service p-circuit-breaker-dashboard standard circuit-breaker-dashboardWhen a Circuit Breaker Service instance is created, three items get provisioned:
-
Hystrix Dashboard application instance
-
Turbine AMQP application instance
-
RabbitMQ Service Instance
This process takes some time and won’t be immediately available for binding. Give it a couple of minutes.
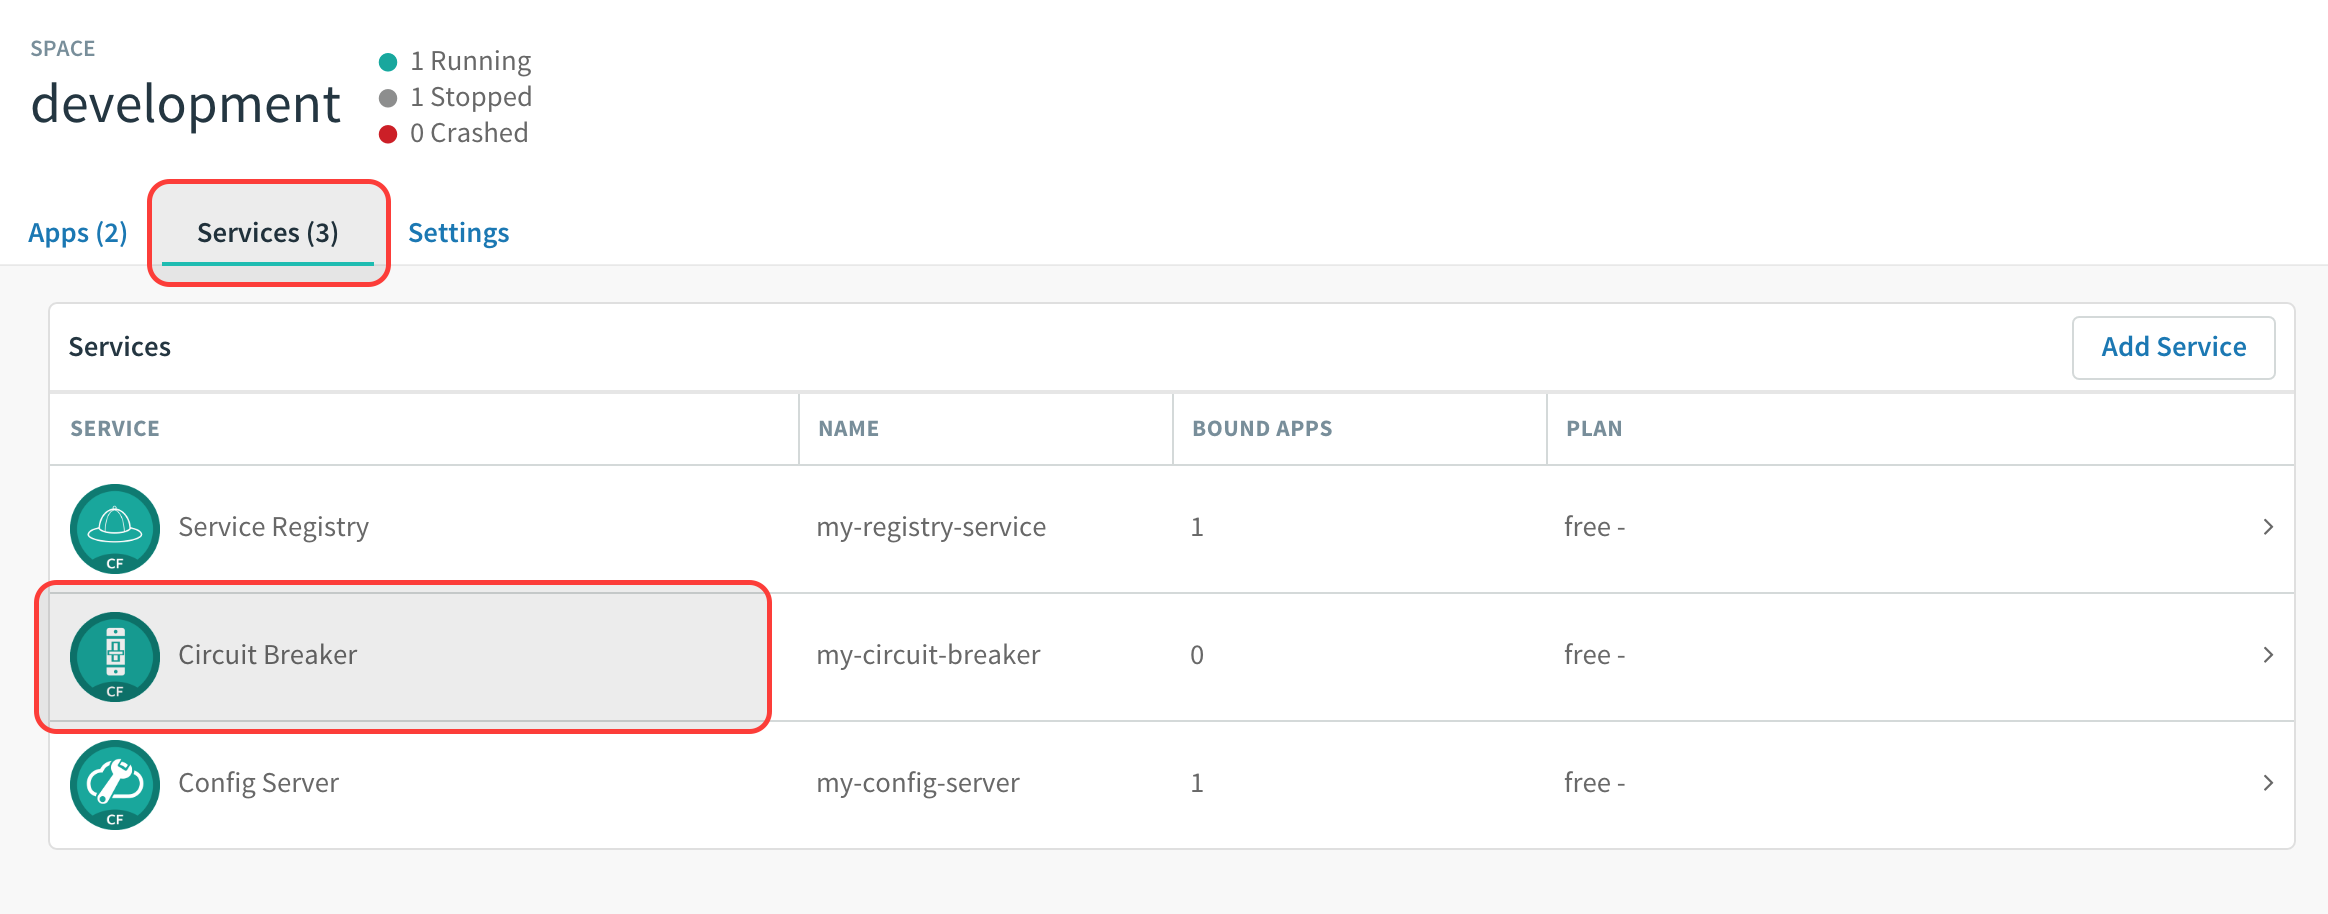
Click on the Services tab and the Circuit Breaker entry to navigate to your service.
Then, click on the Manage link to determine when the
circuit-breakerdashboard is ready.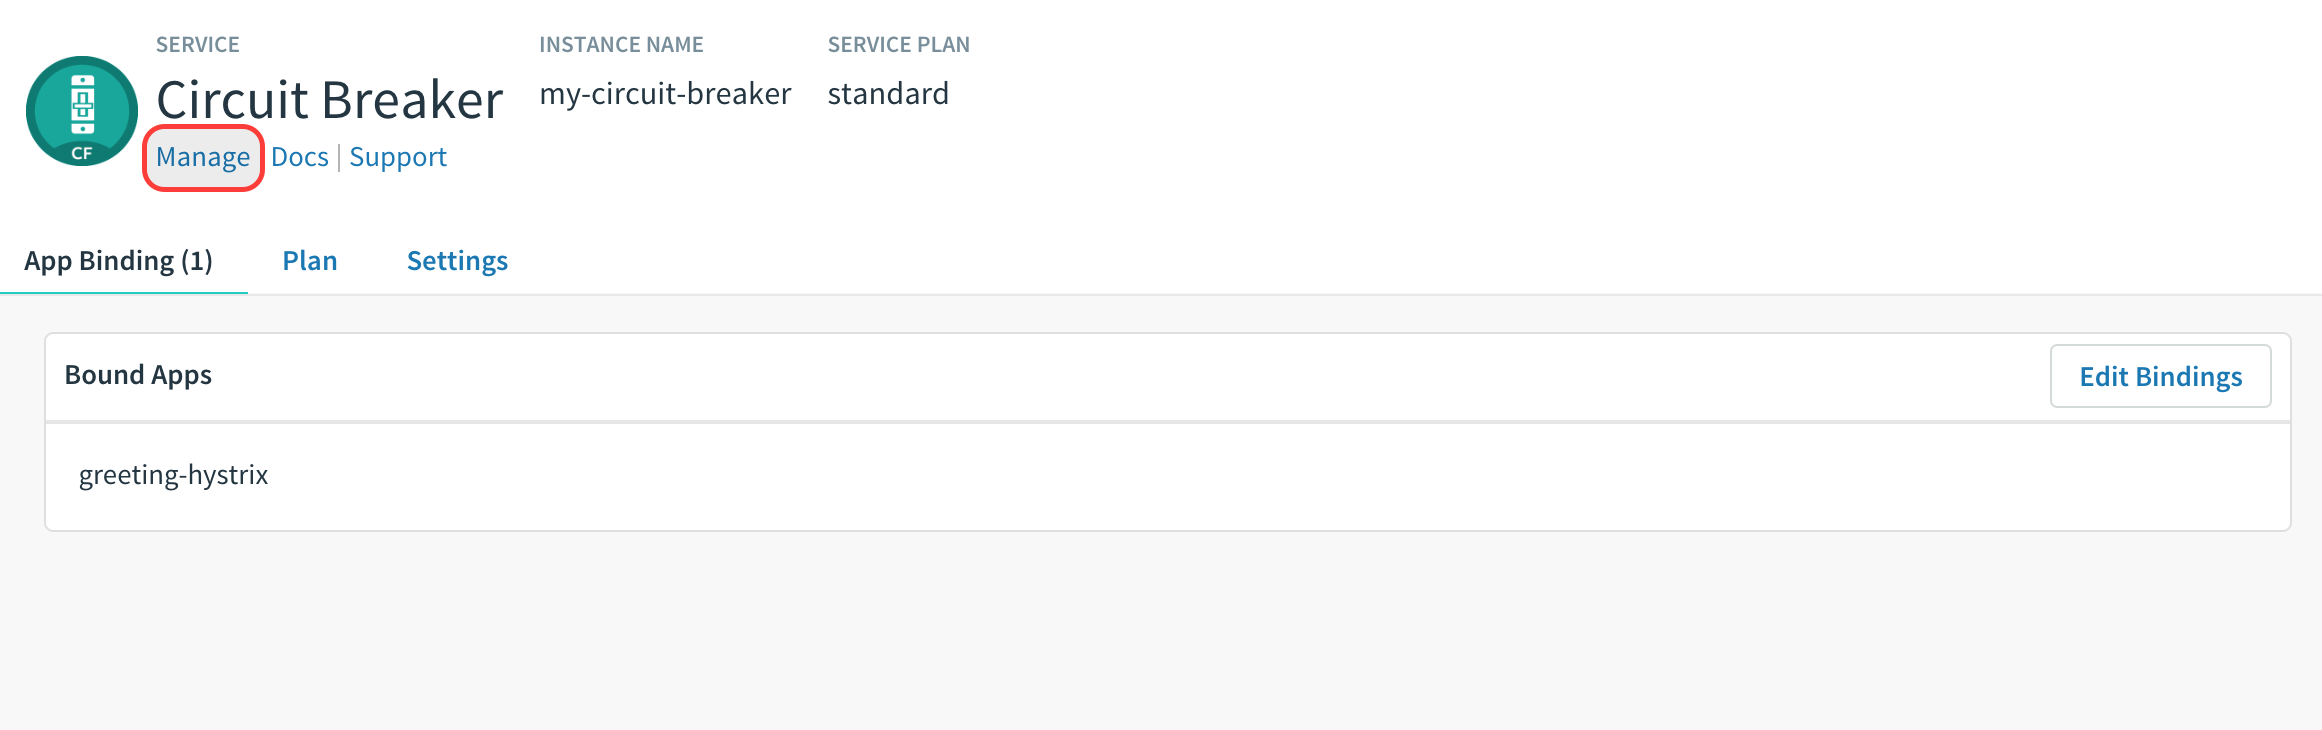
-
-
Package and push the
greeting-hystrixapplication.mvn clean package..and:
cf push greeting-hystrix -p target/greeting-hystrix-0.0.1-SNAPSHOT.jar -m 768M --random-route --no-start -
Bind services for the
greeting-hystrix.$ cf bind-service greeting-hystrix config-server $ cf bind-service greeting-hystrix service-registry $ cf bind-service greeting-hystrix circuit-breaker-dashboardYou can safely ignore the TIP: Use 'cf restage' to ensure your env variable changes take effect message from the CLI. We don’t need to restage at this time.
-
Start the
greeting-hystrixapp.cf start greeting-hystrix -
Experiment! Refresh the
greeting-hystrix/ endpoint several times. Take down the fortune-service app. Scale the greeting-hystrix app. What does the dashboard do?