The Spring Boot reference describes the Actuator as a set of production-ready features for your application. We often discuss the notion of non-functional or cross-functional requirements for an application. For example, the ability to monitor an application. The features provided by this sub-project of Spring Boot are indeed features that any application can use, irrespective of the domain.
1. The actuator starter
As usual, we start with a dependency. Add the actuator dependency to the build:
@@ -16,6 +16,7 @@ dependencies {
   compile 'org.springframework.boot:spring-boot-starter-web'
   compile 'org.springframework.boot:spring-boot-starter-thymeleaf'
   compile 'org.springframework.boot:spring-boot-starter-data-jpa'
+  compile 'org.springframework.boot:spring-boot-starter-actuator'

   compile 'org.springframework.boot:spring-boot-devtools'
➜ Run the application:
$ gradle bootRun
2. The "health" endpoint
A simple example of one actuator feature is the health endpoint.
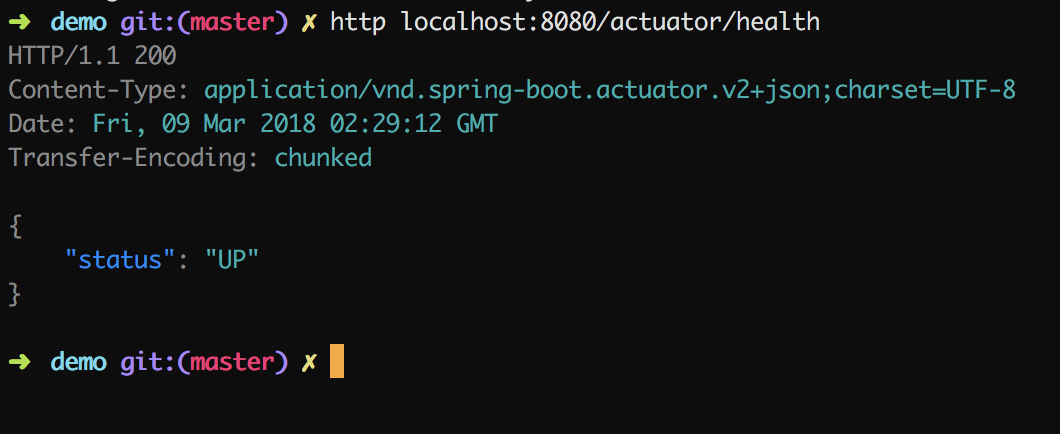
A simple script that calls this endpoint and parses the JSON response to check if the status is UP is all that’s needed to hook up our application to some monitoring and alerting system.
This is the gist of the actuator: to provide a collection of such features for different purposes, which together, save Spring Boot developers and operators time and effort.
These features are also known as management endpoints, and they’re configurable.
2.1. Health endpoint with Details
The JSON response of the health endpoint above was intentionally brief. This same endpoint by default displays more detail when an authenticated user with the proper permission to view those details is requesting them.
➜ Configure the health endpoint to always show details:
@@ -6,6 +6,11 @@ logging:
 hello:
   greeting: Bonjour

+management:
+  endpoint:
+    health:
+      show-details: always
+
 ---
 spring:
   profiles: mysql
➜ Restart the app, and visit http://localhost:8080/actuator/health endpoint once more:
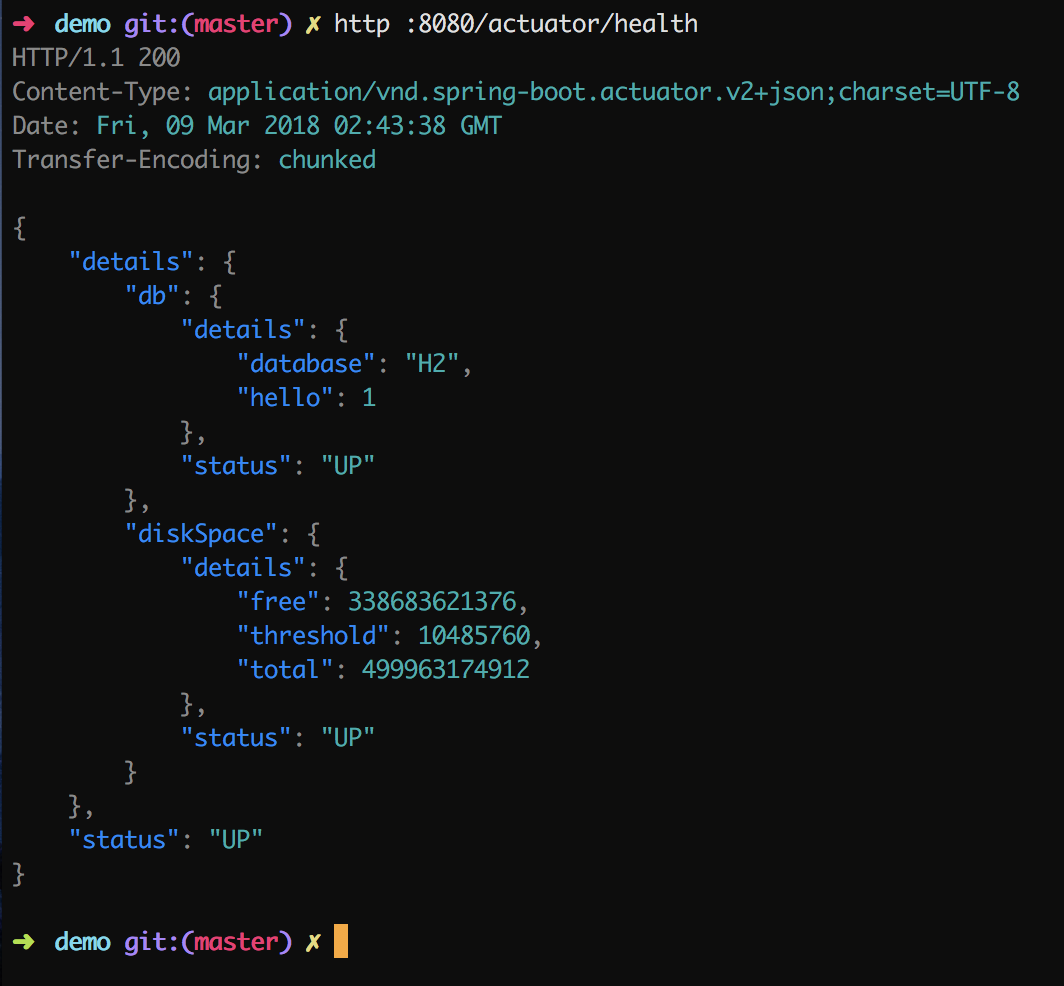
This reveals a great deal about how the health endpoint works: this HTTP call runs a list of checks, which is a function of the application’s capabilities. In this case, we have a database application connected to an H2 database (see last lab), and so we see that the actuator checked the status of the connection to the database. We also see a check for the amount of disk space left, which is another indicator of application health. Since both checks passed, the health status is UP.
Here is a list of what Spring Boot calls health indicators that are automatically configured when appropriate.
2.2. A custom Health Indicator
Say for example that we want to check remaining memory, and report the health to be "DOWN" if remaining memory is less than 10% of total heap?
Boot makes this easy. For health, it provides the interface HealthIndicator and a simple builder-like API for returning the health status and other information to include in the response.
Here’s a simple example where the code is self-explanatory:
package com.example.demo;

import org.springframework.boot.actuate.health.Health;
import org.springframework.boot.actuate.health.HealthIndicator;
import org.springframework.stereotype.Component;

@Component
public class MemoryHealthIndicator implements HealthIndicator {
  @Override
  public Health health() {
    Runtime runtime = Runtime.getRuntime();
    long freeMemory = runtime.freeMemory();
    long totalMemory = runtime.totalMemory();
    double percentFree = 100 * (freeMemory / (double) totalMemory);

    Health.Builder builder = (percentFree < 10) ? Health.down() : Health.up();
    return builder.withDetail("total", totalMemory)
        .withDetail("free", freeMemory)
        .withDetail("percentFree", percentFree)
        .build();
  }
}
In the code above, we:
-
Implement the
HealthIndicatorinterface -
Mark the class a Spring
@Component -
Use the Spring Boot health builder API to construct a health response
The response is combined with additional health checks to produce the complete HTTP response.
Re-start the app and visit the health endpoint once more:
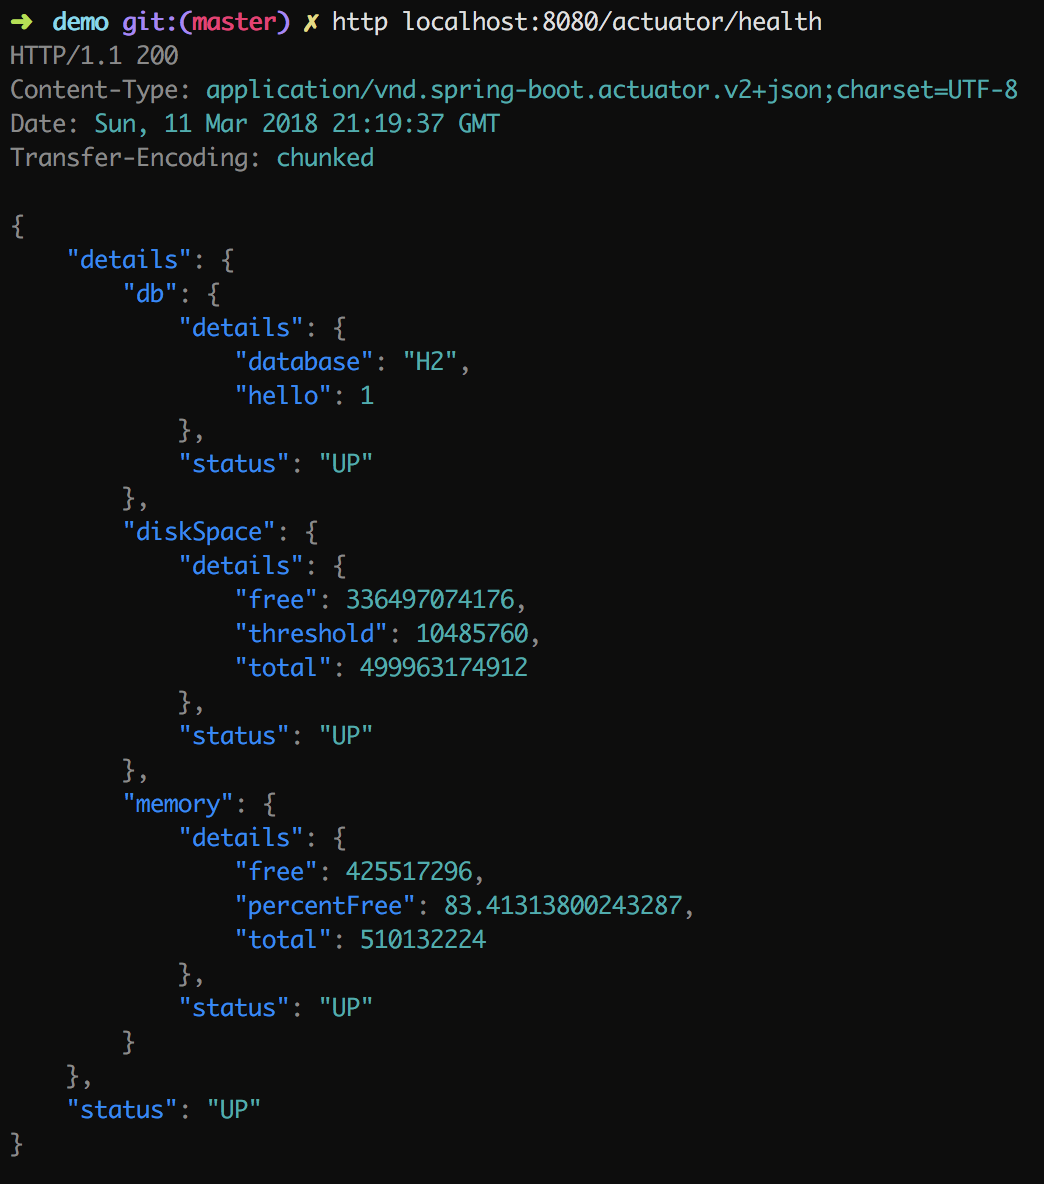
Note the new memory section in the JSON response. It’s that straightforward to customize the response.
➜ Think of a health indicator you’d like to implement, and use the same API shown above to expose your own health indicator.
3. Explore additional actuator endpoints
Unlike the health endpoint, most of the actuator endpoints are not exposed by default. For the sake of exploring these endpoints, configure your application to expose the actuator endpoints.
➜ Add the following configuration to application.yml (in the default profile):
@@ -10,6 +10,10 @@ management:
   endpoint:
     health:
       show-details: always
+  endpoints:
+    web:
+      exposure:
+        include: "*"

 ---
 spring:
Spring Boot’s reference lists the catalog of actuator endpoints. Let’s explore some of them.
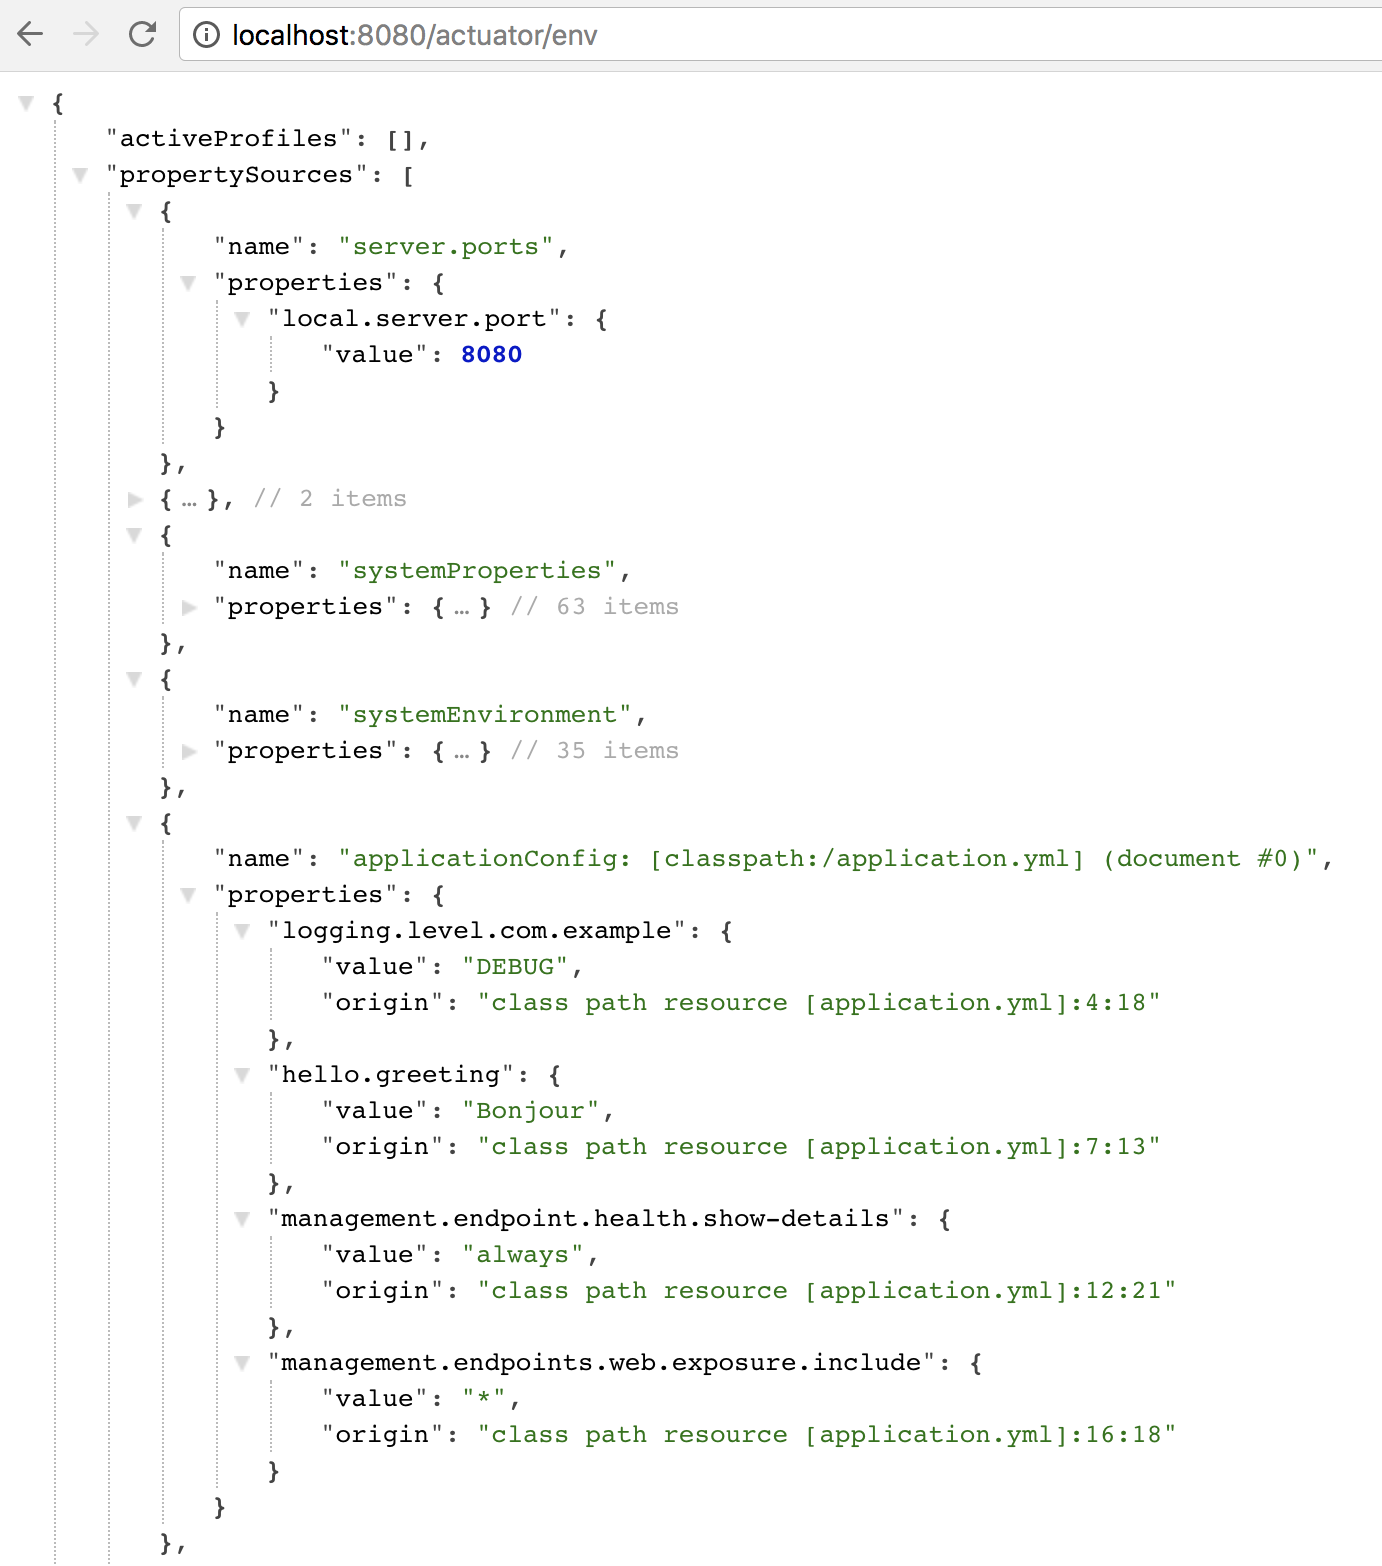
The env endpoint answers the question: How is my application configured? Show me the environment!
It lists Java System properties, environment variables, active profiles, the server configuration, the application configuration, and more. Here’s a screenshot of the response for our demo application:
Explore the /actuator/mappings endpoint. Can you identify Spring MVC endpoints contributed by some of the controllers you wrote in previous labs (TodoController and TodoRestController come to mind)?
Visit the /actuator/beans endpoint if you’re curious to know what Spring beans exist in your application context.
Here are some other endpoints that may be worth looking at:
-
/configprops(look for the HelloProperties configuration) -
/httptrace(last few requests) -
/threaddump(thread dump) -
/conditions(the autoconfiguration report, but over HTTP)
4. The "info" endpoint
This info endpoint is at first a little curious in that it shows nothing:
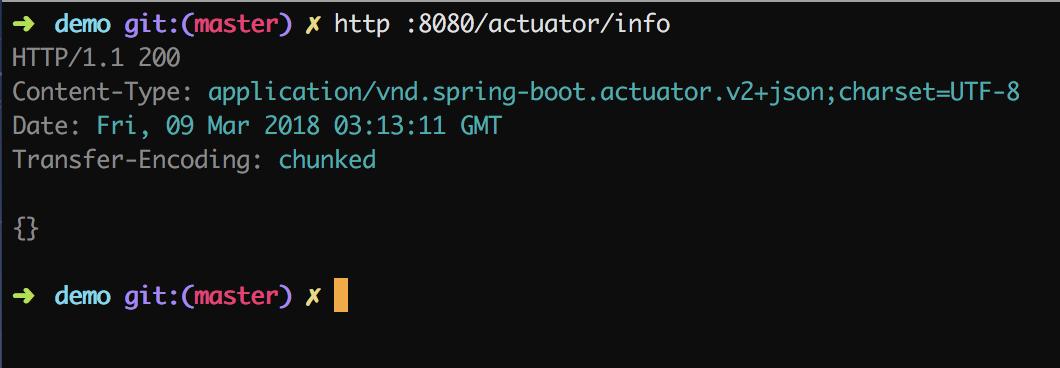
It is common for application developers to manually build an "info" endpoint that supplies metadata such as the application version, perhaps the build number, and even some git information such as the SHA-1 of the commit that represents the exact version of the codebase deployed.
Build and version information comes from the build (maven or gradle).
Just as health endpoints have custom healh indicators, Spring Boot offers a way to expose InfoContributor beans that contribute information to the response of the /info endpoint. Out of the box, build info and git info contributors are provided.
4.1. Build information
The BuildInfoContributor looks for the build information in a file bundled with the application’s jar file inside META-INF/build-info.properties. Gradle can be configured to automatically generate this file by configuring the Spring Boot plugin.
➜ Add the following configuration to your build:
@@ -7,6 +7,10 @@ group = 'com.example'
 version = '0.0.1-SNAPSHOT'
 sourceCompatibility = 1.8

+springBoot  {
+  buildInfo()
+}
+
 repositories {
   mavenCentral()
 }
➜ Recompile your project:
$ gradle clean classes
➜ Verify that the build-info.properties file has been generated:
➜ ls build/resources/main/META-INF
build-info.properties
➜ cat build/resources/main/META-INF/build-info.properties
#Properties
#Thu Mar 08 21:16:45 CST 2018
build.time=2018-03-09T03\:16\:45.530Z
build.artifact=demo
build.group=com.example
build.name=demo
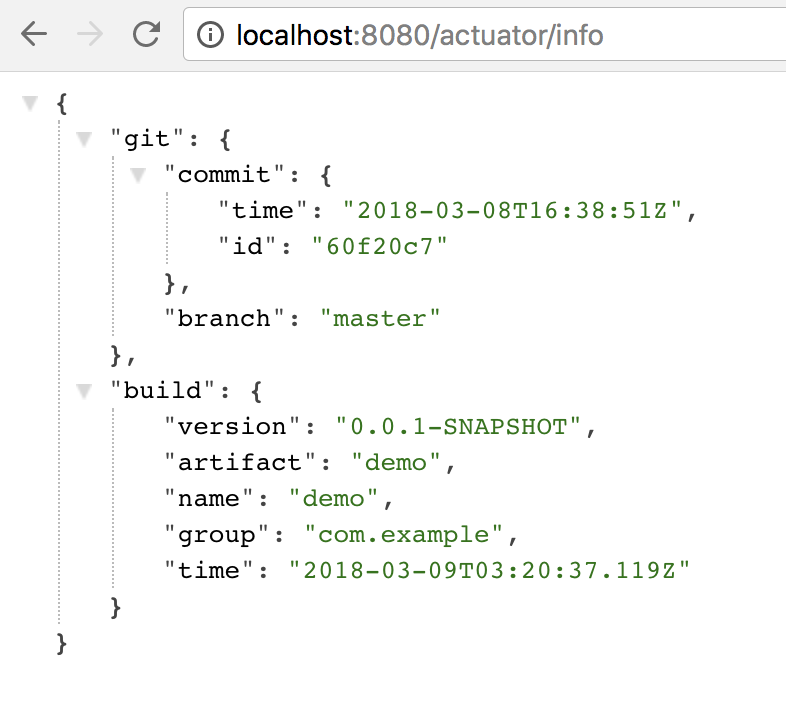
build.version=0.0.1-SNAPSHOTRun the application and re-inspect the info endpoint. Build information should now appear in the JSON response.
4.2. Git Information
The GitInfoContributor works in a similar fashion, looking for and exposing information from a file named git.properties. In gradle, this file can be generated by a plugin.
➜ Make your demo project a git repository (if you haven’t done so already):
$  cd demo
$  git init
Initialized empty Git repository in /Users/esuez/tmp/demo/.git/

$  git add .
$  git commit -m "initial commit"

[master (root-commit) 9344f09] initial commit
 n files changed, p insertions(+), q deletions(-)
 ...

$  git status
On branch master
nothing to commit, working tree clean
➜ Add the following to your build:
@@ -1,12 +1,17 @@
plugins {
  id 'java'
  id 'org.springframework.boot' version '2.0.3.RELEASE'
  id 'io.spring.dependency-management' version '1.0.6.RELEASE'
+  id 'com.gorylenko.gradle-git-properties' version '1.5.1'
 }

 group = 'com.example'
 version = '0.0.1-SNAPSHOT'
 sourceCompatibility = 1.8
➜ Once more, recompile your project:
$ gradle clean classes
➜ Verify that the git.properties file has been generated:
➜  ls build/resources/main
META-INF        application.yml banner.txt      git.properties  static          templates
➜  cat build/resources/main/git.properties
git.branch=master
git.commit.id=60f20c7aa6a7f7f065b0e005e7c155eb7e0752b8
git.commit.id.abbrev=60f20c7
git.commit.user.name=Eitan Suez
git.commit.user.email=esuez@pivotal.io
git.commit.message.short=implementation of jpa lab
git.commit.message.full=implementation of jpa lab

git.commit.time=1520527131
git.commit.id.describe=60f20c7-dirty
git.dirty=true
Run the application and re-inspect the info endpoint. Build information should now appear in the JSON response.
5. The "loggers" endpoint
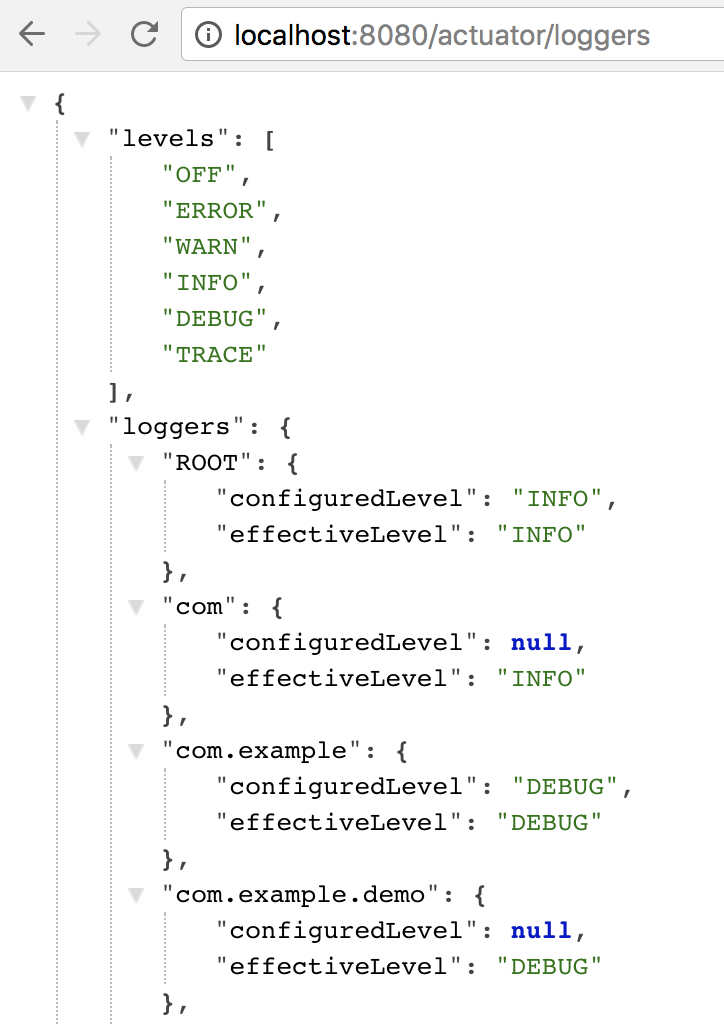
The ROOT logger has log level INFO, and the logging level for the com.example package is currently set to DEBUG, which matches the configuration in application.yml.
Spring Boot exposes additional endpoints: to view the configuration of a specific logger, simply use the URL pattern: actuator/loggers/${loggername}. For example http://localhost:8080/actuator/loggers/ROOT or http://localhost:8080/actuator/loggers/com.example.
We can also alter the logging level of a running application by using the HTTP POST verb to the endpoint of a specific logger. Using either Postman, curl, or httpie, try altering the log level for com.example from DEBUG to INFO:
$ http post :8080/actuator/loggers/com.example configuredLevel=INFO
The response should be an HTTP 204 (Successful response, but with no content).
Re-visit http://localhost:8080/actuator/loggers, and verify that the log level for the com.example logger has changed.
6. Configuration
Spring Boot provides thorough support for configuring management endpoints. Via configuration properties, we can control:
-
Which endpoints to enable.
-
Whether or not to expose the endpoints, over HTTP or JMX.
-
What the url (or "path-mapping") should be for an endpoint.
Where applicable, we also have control over configuration of specific endpoints. One example we’ve already seen dealt with whether health responses should show details.
Here are some simple configuration examples:
➜ Prevent exposure of the mappings and beans endpoints.
-
Open
application.yml -
User the
management.endpoints.web.exposure.excludeproperty to specify a comma-delimited list of endpoint names to exclude
➜ Enable the /shutdown endpoint
This endpoint can prove useful in test scenarios where we might need to create automation around starting and stopping a service before and after a test suite is run.
Unlike many of the endpoints we’ve seen so far, this one must be explicitly enabled.
-
Open
application.ymlonce more -
User the
management.endpoint.shutdown.enabledproperty to turn it on
Since shutdown is an active operation, it must be invoked with the HTTP POST verb.
@@ -10,10 +10,13 @@ management:
   endpoint:
     health:
       show-details: always
+    shutdown:
+      enabled: true
   endpoints:
     web:
       exposure:
         include: "*"
+        exclude: mappings,beans

 ---
spring:-
Start the application
-
Verify that http://localhost:8080/actuator/mappings and http://localhost:8080/actuator/beans are no longer accessible (you should get a 404 response)
-
Exercise the shutdown endpoint:
➜  http post localhost:8080/actuator/shutdown
HTTP/1.1 200
Content-Type: application/vnd.spring-boot.actuator.v2+json;charset=UTF-8
Date: Fri, 09 Mar 2018 04:11:06 GMT
Transfer-Encoding: chunked

{
    "message": "Shutting down, bye..."
}
Here are some additional configuration properties pertaining to actuator endpoints:
-
management.endpoints.web.base-path: allows you to define a base route for all actuator endpoints (the default is/actuator) -
management.endpoints.web.path-mapping.<endpointname>: lets you configure the HTTP route to the endpoint in question. The Spring Boot reference shows a simple example of its usage to alter the url for the health endpoint.
Feel free to experiment further with configuration of the actuator.
7. Summary
In this lab, we learned about Spring Boot’s production ready endpoints: the actuator. We looked at the health, info, and loggers endpoints closely. We learned how to configure these management endpoints, expose them, disable them, etc..
The actuator exposes additional endpoints that were not discussed specifically, and are worth taking the time to review.
One other major actuator endoint needs to be discussed: metrics. Support for metrics and monitoring has been expanded significantly in Spring Boot 2.0, and this discussion deserves a lab of its own.